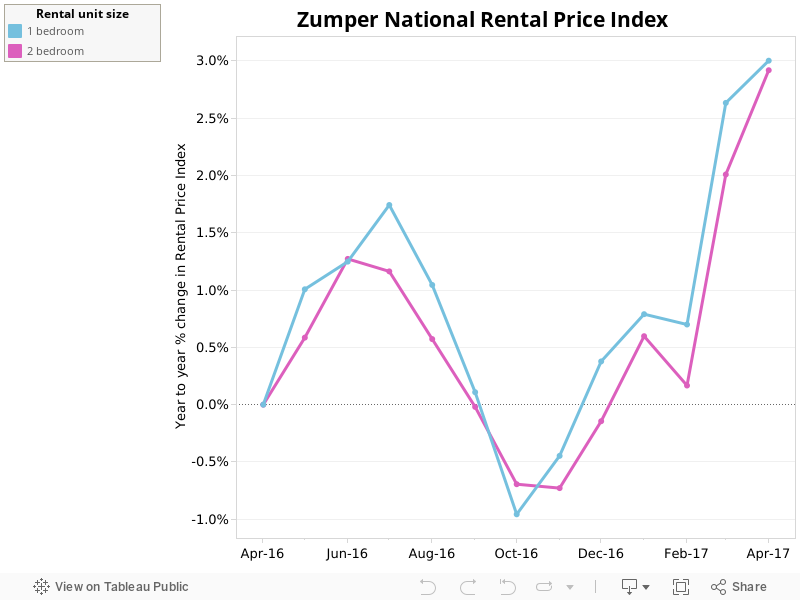
May’s edition of Zumper’s National Rent Report brought another month of mixed changes. The top rental market prices experienced very little change and continued on its trend of plateauing prices. The mid and lower tier markets were more volatile and showed stronger growth and decline in numbers compared to the top ten markets. Overall, the Zumper National Rent Index showed that one bedroom median rent increased slightly by half a percentage point to $1,169 and two bedroom median rent increased 1% to $1,390.
“As we head into peak moving season, renters will be up against a higher apartment turnover rate,” said Zumper CEO Anthemos Georgiades. “In such a crowded market over this upcoming summer, renters can look to median price data and other tools from Zumper to make the whole renting experience easier and more transparent.”
Check out the table below to see how prices in your city have changed.
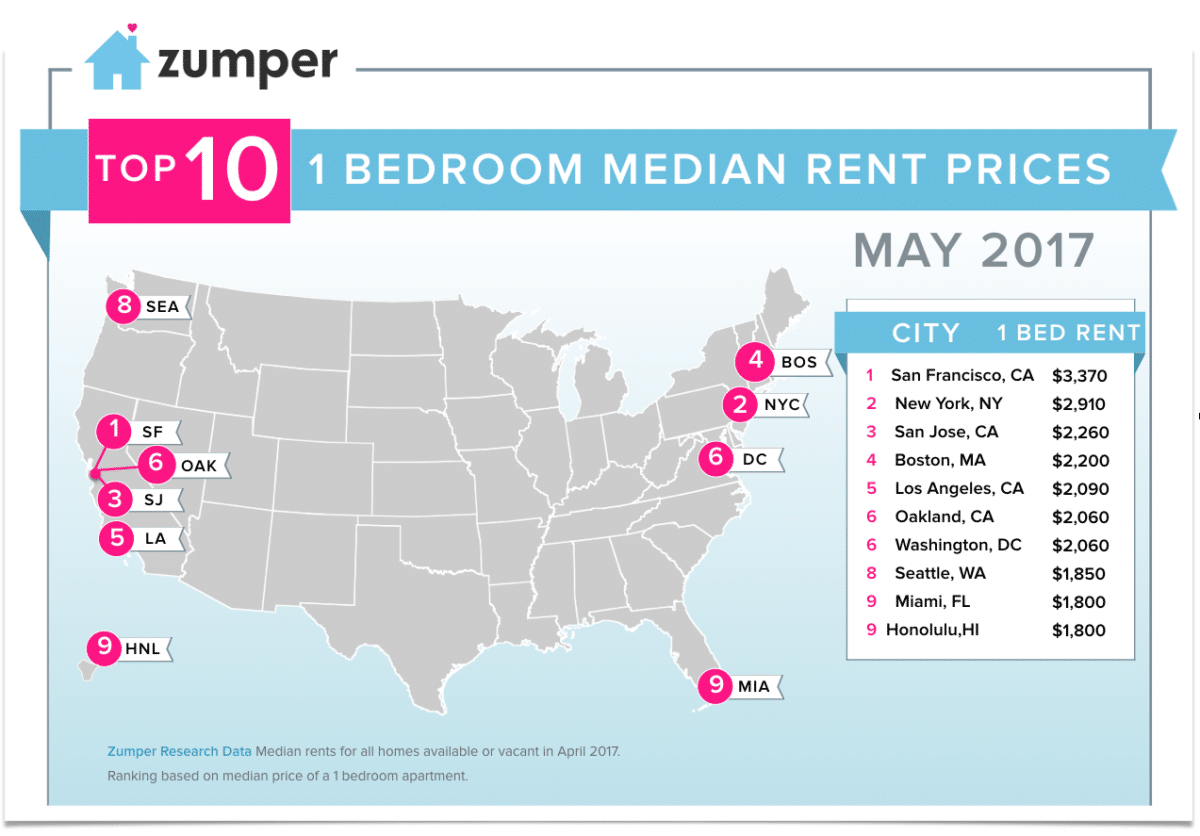
Top Five Rental Markets
1. San Francisco, CA topped the list again as the most expensive market in the U.S. Median one bedroom rent prices grew 1.5% to $3,370, while two bedroom rent experienced similar growth, jumping to $4,500 after a 1.6% increase.
2. New York, NY experienced falling prices for both apartment types this month. One and two bedroom prices dropped about 1% to $2,910 and $3,450, respectively.
3. San Jose, CA remained third despite seeing no change in one bedroom rent. The median price for one bedroom units this month was $2,260. Two bedroom median rent, on the other hand, rose to $2,850, marking a 1.1% hike.
4. Boston, MA did not have any changes in prices this month. The price of one bedroom apartments stayed at $2,200 and two bedroom apartments also remained stable at $2,600.
5. Los Angeles, CA climbed up a spot this month, outpacing Oakland and moving into the top five markets. The price for one bedroom apartments bumped up 1% to $2,090, while two bedroom apartments increased 1.5% to $2,980.
Notable Changes This May
![]() Upward
Upward
– Denver, CO moved up two spots to 22nd after a month of significant price growth. Leading the charge was the spike in one bedroom prices, up 3.3% to $1,250.
– Baltimore, MD also saw a month of rapid growth. Rent across both apartment types skyrocketed 5.2%, shifting the median price for one and two bedroom apartments up to $1,210 and $1,700, respectively.
– Newark, NJ leapfrogged its way up five spots to 40th. The median price for one bedroom apartments rose 5.4% to $970, also marking a 14.1% increase since this time last year.
– Salt Lake City, UT‘s apartment prices climbed about 4.3% this month, bringing one and two bedroom median rent to $920 and $1,200, respectively.
– Glendale, AZ moved up four spots to 67th on the list. Substantial growth in one bedroom prices, up 4.3%, brought the median rent to $730. Meanwhile, the 2.3% monthly growth in two bedroom prices brought that price tag to $900.
![]() Downward
Downward
– Oakland, CA slipped out of the top five markets after a slight drop in prices. Median rent for one bedroom units was $2,060, down 0.5%, and for two bedroom units was $2,500, down 2%.
– Providence, RI dropped two spots to 16th after a downturn in prices this month. Median rent for one bedroom apartments fell to $1,350, while median rent for two bedroom apartments decreased to $1,410.
– Minneapolis, MN fell out of the top 20 after moving down four spots to 21st. This movement is mainly due to the 5.2% drop in one bedroom price.
– Houston, TX‘s apartment prices took a nose dive this month. Prices for both unit types went down 5%. One bedroom prices sunk to $1,090, while two bedroom prices decreased to $1,360.
– Kansas City, MO moved down eight spots to 53rd after one bedroom prices dipped 4.3% to $880. Two bedroom rent, on the other hand, was up a slight 1.1% to $940.
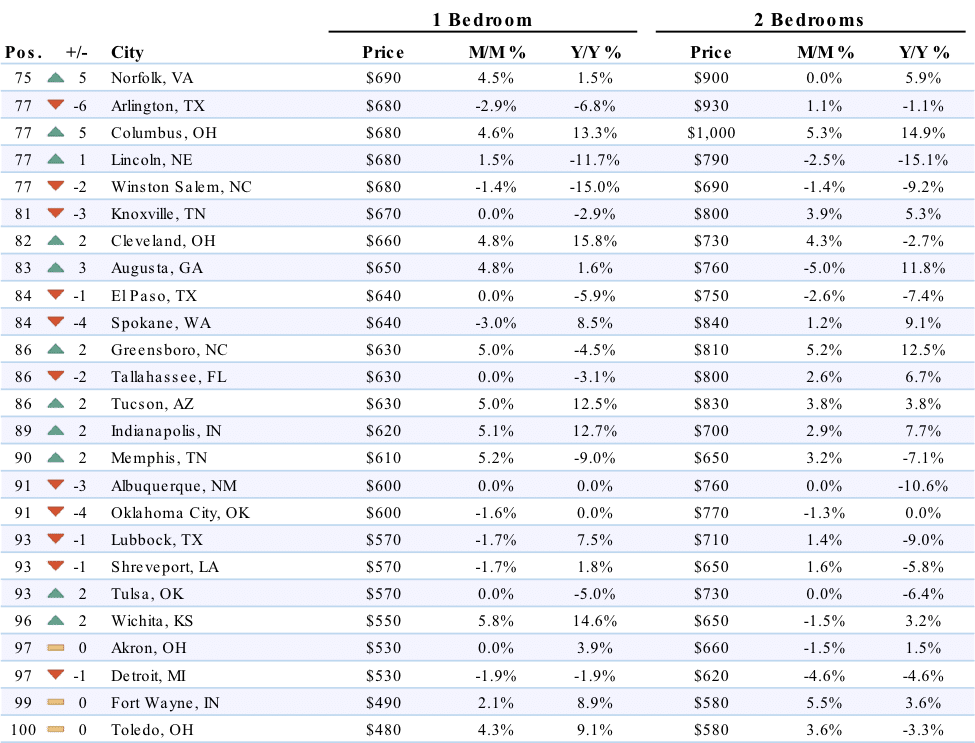
Full Dataset
| One Bedroom | Two Bedrooms | ||||||
|---|---|---|---|---|---|---|---|
| Pos. | City | Price | M/M % | Y/Y % | Price | M/M % | Y/Y % |
| 1 | Broomfield | $1,440 | -1.40% | 12.50% | $1,690 | -0.60% | 12.70% |
| 2 | Centennial | $1,300 | -0.80% | 0.00% | $1,720 | 1.20% | -5.00% |
| 2 | Parker | $1,300 | 4.80% | 7.40% | $1,560 | 1.30% | 0.00% |
| 3 | Denver | $1,250 | 3.30% | 4.20% | $1,700 | 1.20% | -3.40% |
| 3 | Lakewood | $1,250 | 3.30% | 13.60% | $1,370 | 4.60% | 3.80% |
| 4 | Castle Rock | $1,200 | 4.30% | 0.00% | $1,370 | -4.90% | -8.70% |
| 5 | Westminster | $1,180 | 0.00% | -1.70% | $1,430 | -1.40% | 2.10% |
| 6 | Littleton | $1,150 | 0.90% | 15.00% | $1,560 | 2.60% | -2.50% |
| 7 | Arvada | $1,050 | 1.90% | 6.10% | $1,330 | 3.90% | 2.30% |
| 8 | Northglenn | $1,030 | -1.00% | 3.00% | $1,360 | 4.60% | 15.30% |
| 9 | Thornton | $1,010 | -4.70% | -9.00% | $1,270 | -5.20% | 2.40% |
| 10 | Aurora | $990 | -2.90% | 6.50% | $1,360 | 0.00% | 8.80% |
About
The Zumper National Rent Report analyzes rental data from over 1 million active listings across the United States. Data is aggregated on a monthly basis to calculate median asking rents for the top 100 metro areas by population, providing a comprehensive view of the current state of the market. The report is based on all data available in the month prior to publication.
To keep up to date with rent changes across the country, like or follow Zumper on Facebook, Twitter, and Instagram. In the market for a new place? Search apartments for rent on Zumper.
Related content