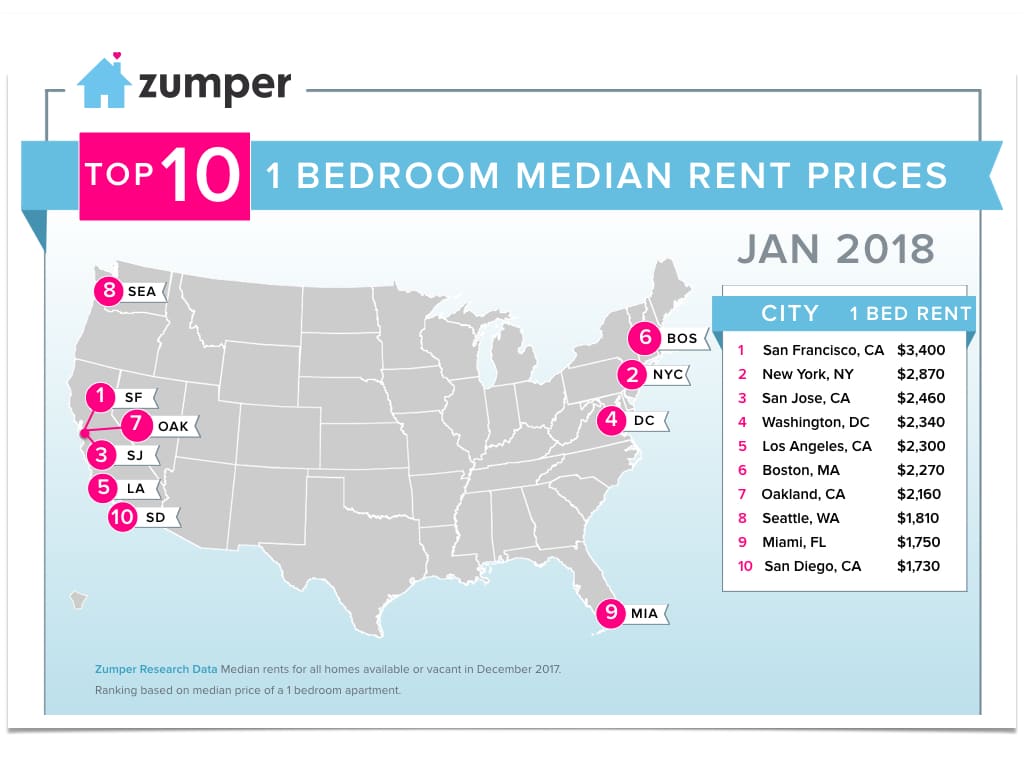
As 2017 comes to an end, we can see what kind of trends the top markets were hit with this year. Unlike the previous year, the top two cities saw some relief with relatively stable prices this year. San Francisco saw less than a 2% bump for one bedrooms and a nearly 3% decrease for two bedrooms while New York City saw yearly decreases for both bedroom types. Boston and Miami had a quiet year for rents as well. Chicago even fell out of the top markets in our April rent report and has remained out of it ever since. Meanwhile, San Jose, D.C., Los Angeles, and San Diego saw huge yearly rent spikes, all with one bedroom prices up over 10%.
As displayed on our infographic, a notable year end note was that 5 of the top 10 markets belong in California. Long Beach was also not too far behind from the top ten cities either, ranking as thirteenth. It’s no secret that California has always been expensive but seeing 50% of the cities in the top ten markets residing solely in California just continues to affirm the strong demand for housing in this state.
Overall, the national one bedroom rent grew 2.1% to $1,255, while two bedrooms increased a slight 0.2% to $1,388. On a year over year basis, one bedroom prices are up 9.8%. Two bedrooms had a smaller yearly bump, growing 2.2%. Notably, the national one bedroom rent is surprising since it had such a large spike compared to this time last year, signaling that more people seem to be moving, increasing demand, during this usually slow season.

Top Five Rental Markets
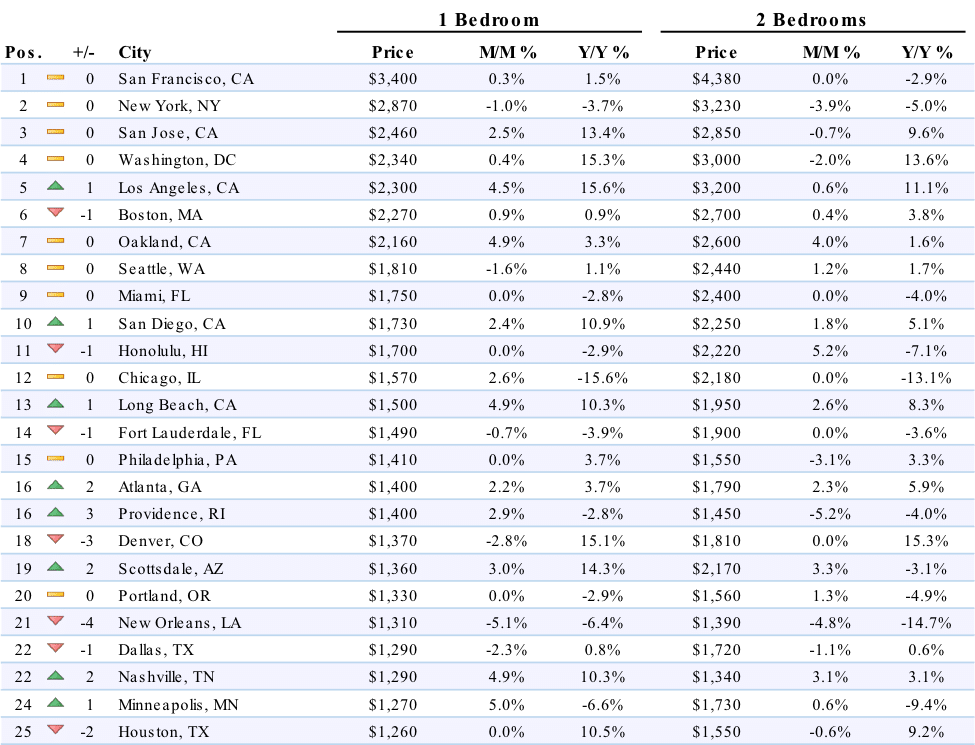
1. San Francisco, CA climbed back into the $3,400 threshold for one bedroom rent this month, growing 0.3%. Two bedrooms, on the other hand, remained flat at $4,380.
2. New York, NY saw one bedroom rent fall 1% to $2,870, while two bedrooms took an even deeper dive, down 3.9% to $3,230. Though on a downward trend, New York City held onto its position as the second most expensive city in the nation.
3. San Jose, CA one bedroom prices grew 2.5% to $2,460, while two bedroom rent fell a slight 0.7% to $2,850. While relatively steady this month, on a year over year basis, one bedroom rent is up over 13%.
4. Washington, DC remained the fourth most expensive city to rent with one bedroom rent increasing a slight 0.4% to $2,340 and two bedrooms falling 2% to $3,000. Both bedroom types have prices up over 13% since this time last year.
5. Los Angeles, CA moved into the top 5 markets, outpacing Boston, with one bedroom rent growing 4.5% to $2,300. Two bedrooms had a smaller increase, up 0.6% to $3,200. This city had the largest yearly one bedroom rent increases of the top 10 markets, up 15.6%.
Notable Changes This Month
![]() Upward
Upward
–San Diego, CA moved up one spot and back into the top ten markets with one bedroom rent growing 2.4% to $1,730. Two bedrooms saw a slightly smaller increase, up 1.8% to $2,250.
–Nashville, TN climbed up two spots to rank as the twenty-second most expensive city with one bedroom prices growing 4.9% to $1,290 and two bedroom rent increasing 3.1% to $1,340. On a year over year basis, one bedroom rent is up over 10%.
–Minneapolis, MN rent grew 5% last month, settling at $1,270, and jumped up one spot to become the twenty-fourth priciest rental market. Two bedroom prices, on the other hand, saw a much smaller change, increasing a slight 0.6% to $1,550.
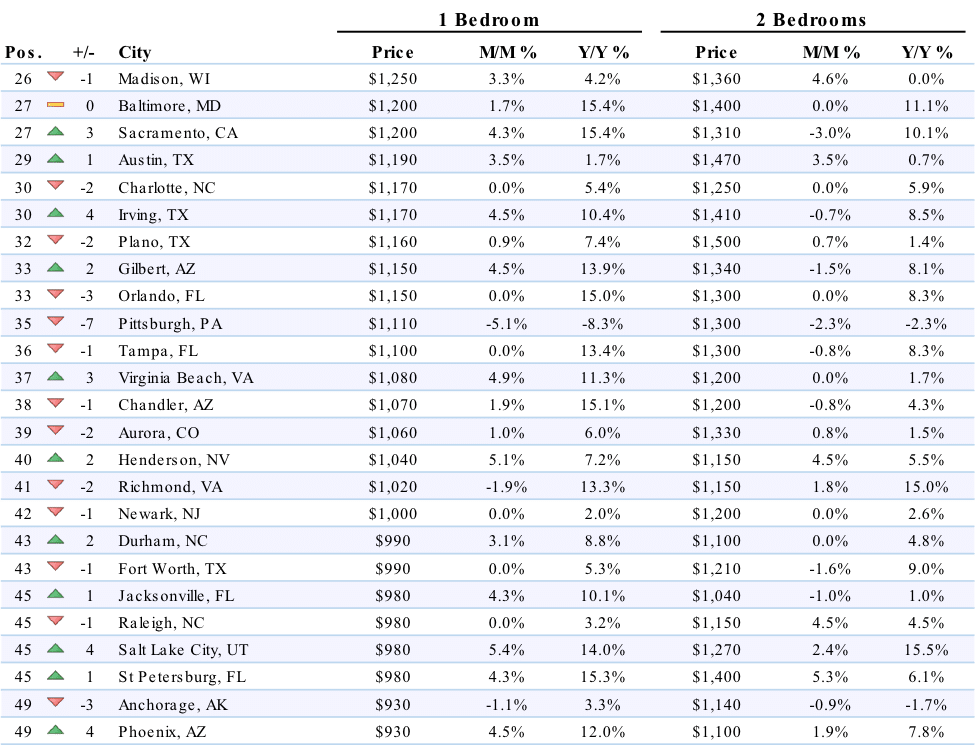
–Sacramento, CA bumped up three spots to rank as the twenty-seventh most expensive city with one bedroom rent growing 4.3% to $1,200.
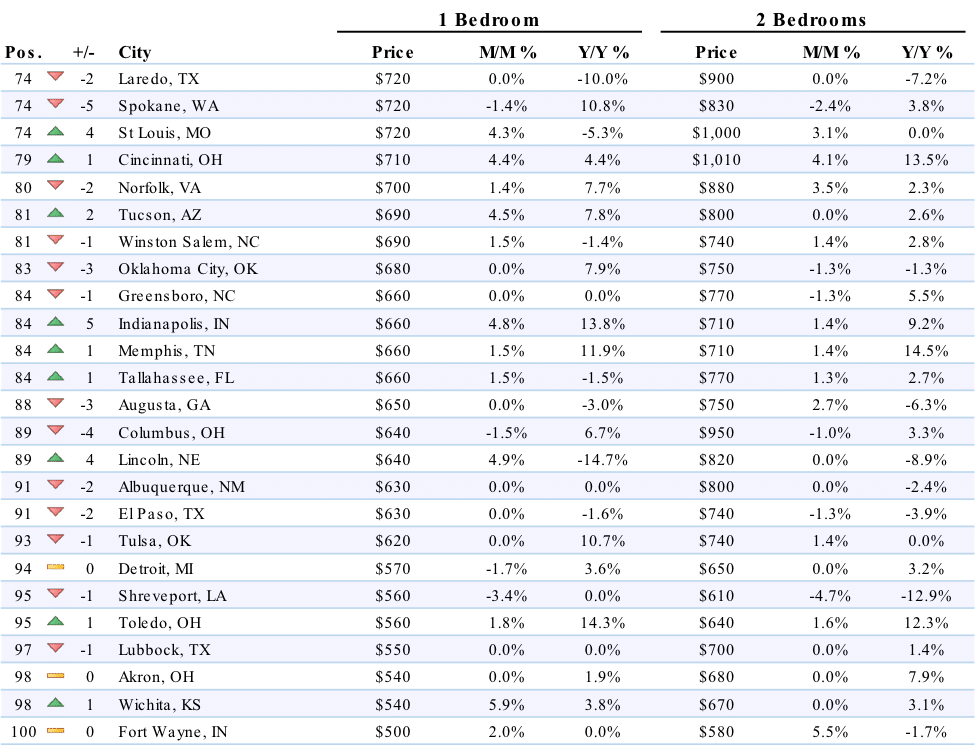
–Wichita, KS had the largest one bedroom monthly rental growth rate in the nation, up 5.9% to $540. Two bedrooms remained flat at $670.
![]() Downward
Downward
–Honolulu, HI fell down one spot and out of the top ten markets. One and two bedroom rents settled at $1,700 and $2,220, respectively. On a year over year basis, two bedroom rent is down 7.1%.
–Denver, CO moved down three spots, now ranking as eighteenth. One bedroom prices fell 2.8% to $1,370, while two bedrooms had a flat month and remained at $1,810.
–New Orleans, LA tied with Pittsburgh for having the biggest rent decrease for the month, down 5.1%. One bedrooms here settled at $1,310. Two bedrooms also saw a big drop, down 4.8% to $1,390.
–Pittsburgh, PA saw a seven ranking dip to become the thirty-fifth most expensive city. One bedroom rent decreased 5.1% to $1,110, while two bedrooms fell 2.3% to $1,300. One bedroom prices here are down over 8% since this time last year.
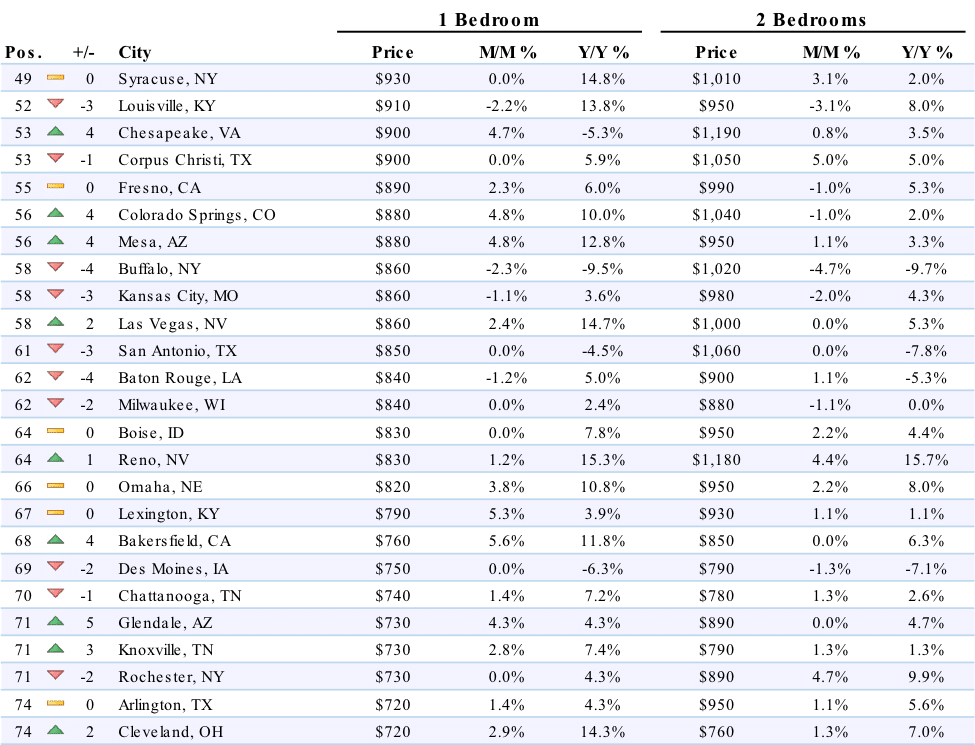
–Buffalo, NY dropped down four spots to rank as the fifty-eight priciest rental market. One bedroom prices decreased 2.3% to $860, while two bedrooms saw a larger dip, down 4.7% to $1,020.
Full Data
1 Bedroom 2 Bedrooms
Pos. City Price M/M % Y/Y % Price M/M % Y/Y %
1 San Francisco $3,400 0.30% 1.50% $4,380 0.00% -2.90%
2 Mountain View $3,270 5.10% 15.50% $3,670 4.90% 7.60%
3 Emeryville $2,890 3.60% 9.90% $3,520 -4.10% -0.60%
4 Palo Alto $2,830 4.40% 0.40% $3,500 -3.60% -3.30%
5 Redwood City $2,750 1.90% 8.70% $3,690 5.10% 2.20%
5 Sunnyvale $2,750 3.80% 11.30% $3,120 0.60% 6.10%
7 San Mateo $2,580 3.20% 2.80% $3,370 -1.50% 6.60%
8 Santa Clara $2,550 3.70% 15.90% $3,140 4.30% 15.90%
9 Milpitas $2,470 0.00% 6.00% $2,750 5.00% 1.50%
10 San Jose $2,460 2.50% 13.40% $2,850 -0.70% 9.60%
11 Daly City $2,410 -2.00% 7.10% $3,070 -5.00% 2.00%
12 Berkeley $2,400 -3.20% 0.00% $3,050 1.70% -1.30%
13 Burlingame $2,380 -0.40% 4.40% $3,270 -1.20% 16.00%
14 South San Francisco $2,340 2.60% -2.90% $3,190 -1.80% 12.70%
15 Walnut Creek $2,310 -1.30% 15.50% $2,740 -1.80% 9.60%
16 Fremont $2,200 1.40% 4.30% $2,530 1.20% 4.10%
17 Pleasanton $2,170 0.50% 1.40% $2,680 3.50% 3.50%
18 Oakland $2,160 4.90% 3.30% $2,600 4.00% 1.60%
19 Union City $2,140 0.90% 0.00% $2,560 3.20% 2.80%
20 Alameda $2,130 1.40% 0.00% $2,700 3.10% 0.40%
21 Petaluma $2,070 5.10% 14.40% $2,400 3.40% 3.90%
22 San Ramon $2,000 -1.50% 0.00% $2,460 -0.40% 3.40%
23 Livermore $1,990 4.70% 15.70% $2,390 4.80% 11.70%
24 Hayward $1,960 3.20% 7.70% $2,270 -0.90% 7.10%
25 Richmond $1,890 5.00% 5.00% $2,290 -2.60% 15.70%
26 San Leandro $1,770 -0.60% 4.10% $2,260 -0.40% 5.10%
27 Concord $1,650 4.40% 15.40% $1,880 -3.10% 11.20%
28 Napa $1,640 5.10% 6.50% $2,300 4.10% 4.50%
29 Santa Rosa $1,570 1.90% 7.50% $2,100 5.00% 10.50%
30 Vallejo $1,430 5.10% 2.10% $1,560 -0.60% 10.60%
About
The Zumper National Rent Report analyses rental data from over 1 million active listings across the United States. Data is aggregated on a monthly basis to calculate median asking rents for the top 100 metro areas by population, providing a comprehensive view of the current state of the market. The report is based on all data available in the month prior to publication.
If you’re interested in a more in-depth explanation of how and why we calculate our rent data, view our methodology post.
To keep up to date with rent changes across the country, like or follow Zumper on Facebook, Twitter, and Instagram. In the market for a new place? Search apartments for rent on Zumper.
Related content