The COVID-19 pandemic set off a wave of domestic migration not seen in generations, causing a dramatic disruption in rental markets that’s still playing out. According to a Zumper survey conducted for this report, 26.2 percent of respondents say they have moved since the pandemic began, and another 15.7 percent are still looking for a new home. Thus far, the disruption to rental markets has come in two phases: the period after the pandemic began and the period after the vaccine became widely available. With the pandemic potentially entering a new, third phase as a result of the highly contagious Delta variant of COVID-19, it’s worth examining how the first two phases of the pandemic affected rental prices across the country. These insights will help us understand how we got here and where we might be going as a result of the Delta variant.
About This Report
This report analyzes rent in the 100 most populous cities in the United States to show how rent has moved over the course of the pandemic, using March 2020 as the baseline for comparison. We compare rent in March 2020 to rent in two other months — January 2021 and July 2021, or present day. Using March 2020 as the baseline as opposed to a year-over-year number allows us to directly assess how rent has changed over the course of the pandemic. We chose January 2021 as the dividing point because that is when the vaccine first became available. There’s also a clear shift in our rental data beginning in January 2021 that suggests the vaccine changed the trajectory of rent in many markets across the country.
After assessing the data, we were able to classify cities into six rental trend classifications according to how they changed from March 2020 to January 2021, and then from January 2021 to the present. For example, one classification is for cities where rent dropped from March 2020 to January 2021, and then stayed flat from January 2021 to present. Another classification is for cities where rent dropped through January 2021 but then began to rise after. In a lot of markets, rent has consistently risen throughout the pandemic, as the scorching home sales market has forced would-be buyers to stay renters, thus driving up rent.
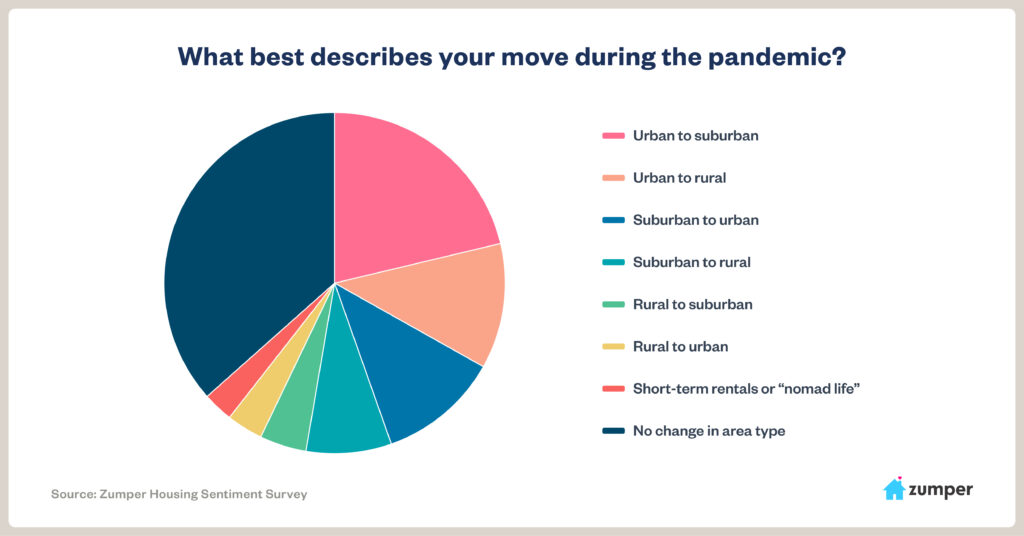
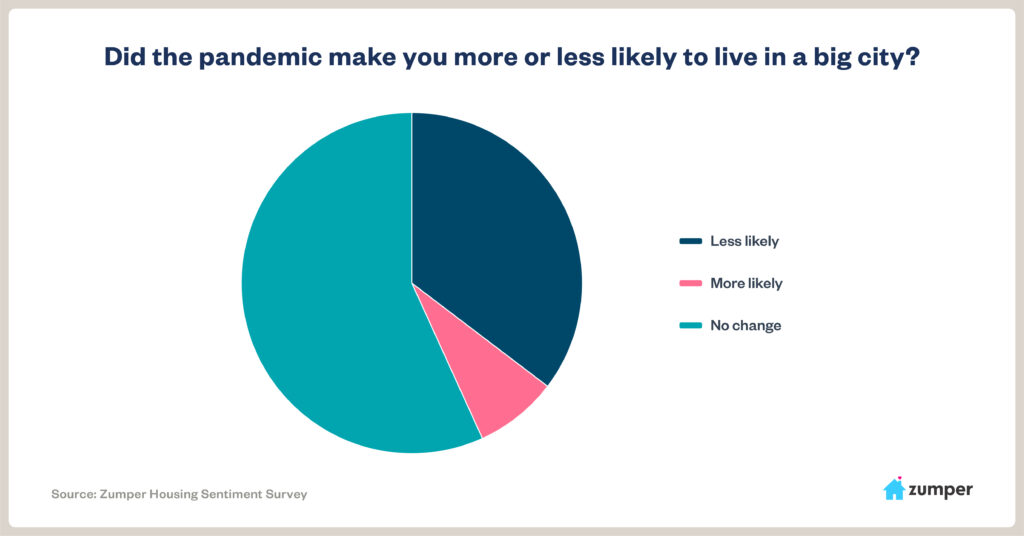
This report also incorporates a survey Zumper conducted on housing sentiment to better understand the views and mindsets that led to changes in rent over the course of the pandemic. The survey reveals a clear shift in preference away from living in big cities coupled with a growing preference toward living in suburbs. However, the survey shows that sentiment is less prevalent among younger generations, suggesting big cities will still be a draw for young single professionals. For this report, references to rent are defined as the median one-bedroom apartment rent for the given city. All percentage change numbers are relative to March 2020.
Rent remains down in many urban cities
One of the most talked about housing storylines of the pandemic was people leaving urban cities in the immediate aftermath of the pandemic. While studies have shown this phenomenon to be a bit overblown, there’s no question it occurred in some of the country’s more expensive markets, namely New York and San Francisco, which saw precipitous rent drops between March 2020 and January 2021. Of the respondents who moved during the pandemic, Zumper’s housing sentiment survey showed that 21.3 percent of respondents who moved during the pandemic went from an urban area to a suburban area, and another 11.8 percent of movers went from an urban area to a rural area.
This is reflected in the rental price data as well. Between March 2020 and January 2021, the Bay Area’s three major cities — San Francisco, Oakland, and San Jose — saw rents fall by 23.4 percent, 16.7 percent, and 16.5 percent, respectively. While these cities have seen minor upticks in rent since January 2021, rent today is still down considerably compared to March 2020. This is because many of the people who left the Bay Area after the pandemic hit have yet to return, as tech companies are more likely to have adopted permanent work-from-home policies or simply haven’t reopened their offices yet. Should either of those two things change, it will likely bring people back to the Bay Area and push rent back up.
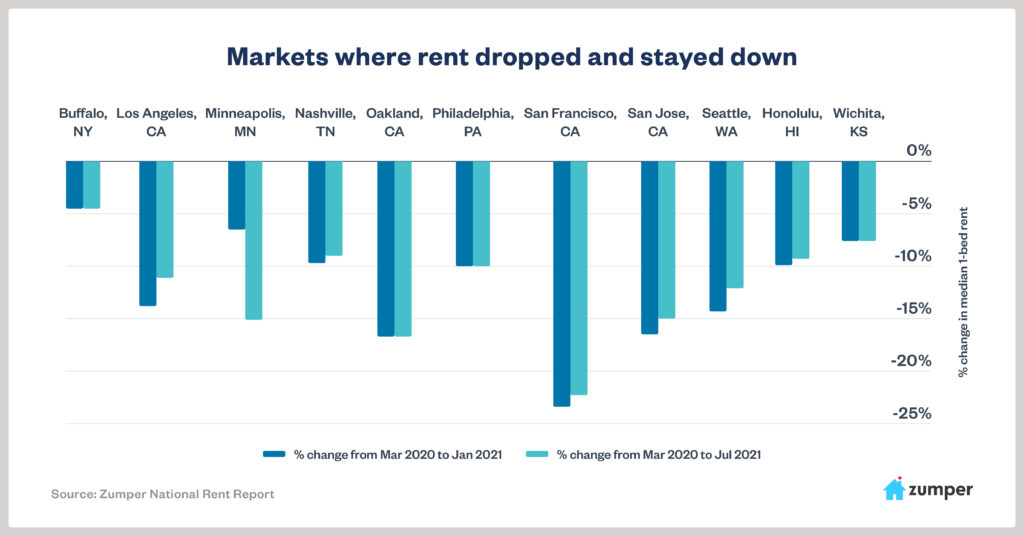
But it’s not just the Bay Area where rent has stayed down. Los Angeles rent today is down 11.1 percent compared to March 2020. Seattle (12.1 percent), Philadelphia (10 percent), Nashville (9 percent), Minneapolis (15.1 percent), and Honolulu (9.3 percent) have experienced a similar trend. The emergence of the Delta variant could keep rent down in these cities for the foreseeable future because of its potential to further delay office reopenings and pause or reverse the lifting of various pandemic precautions, like capacity restrictions on dining and events.
But some urban cities are experiencing rising rents
While much of the urban areas on the West Coast have seen rent stay flat over the course of 2021, many cities on the East Coast that experienced rent drops after March 2020 have started to reverse course. New York City is a prime example. Relative to March 2020, rent in the Big Apple was down 17.5 percent in January 2021, but today is down only 5.9 percent compared to March 2020. New Yorkers were quick to adopt the vaccine and as a result, local officials lifted pandemic restrictions, which drew residents back to the city. While many offices in NYC remain closed, the city’s job market is less dependent on the tech sector than the Bay Area, which has kept a number of residents in town. New York also offers cultural and nightlife amenities that have drawn people back to the city.
There’s no doubt that there’s a broad shift in preference away from urban areas, but that doesn’t mean it’s universal. Of the people who say they moved during the pandemic in Zumper’s housing sentiment survey, 11.5 percent moved from a suburban area to an urban area. Some of these people were likely taking advantage of the sudden drop in rent. Others may have felt safer in the city because residents in urban areas were more likely to adhere to pandemic precautions than suburban areas, particularly in the south. While the adoption of work-from-home policies drew residents out of urban areas, the inverse happened as well; a suburban resident who always wanted to live in the city might be able to do so now that their job allows them to work from anywhere.
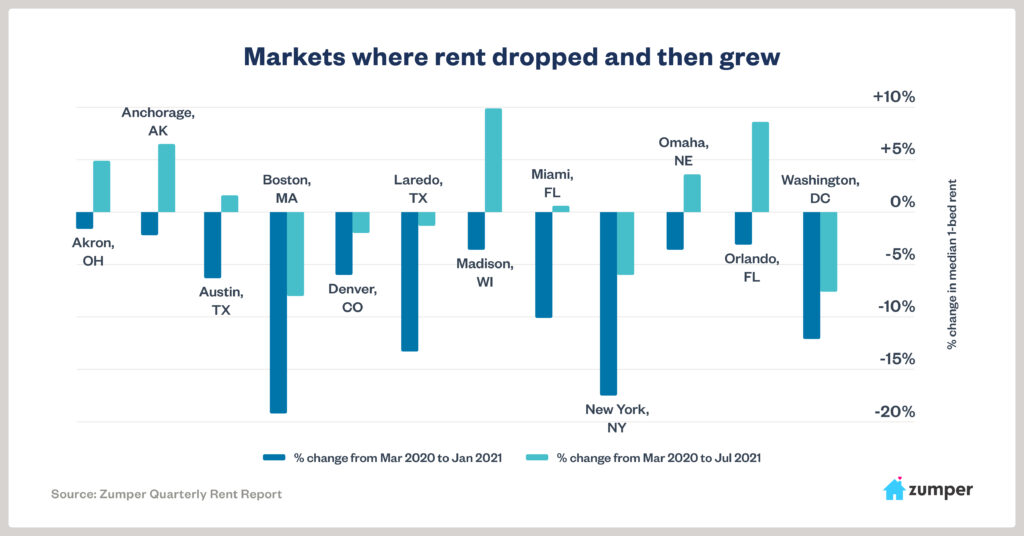
New York isn’t the only city that’s seen rent rise over the course of 2021. Compared to March 2020, Boston rent was down 19.2 percent in January 2021 but is now down only 8 percent. Miami was down 10.1 percent in January but is now up 0.6 percent. Washington, D.C., rent rises have been more modest, as it was down 12.1 percent in January and is now down 7.6 percent. Madison, WI, was down 3.6 percent in January and is now up 9.9 percent.
Some ‘destination’ cities see rent fall back to pre-pandemic levels
As urban dwellers and suburbanites alike relocated at the beginning of the pandemic, a number of mid-sized or smaller cities saw a sudden influx in population that drove up rent. While a number of these “pandemic destination” cities either retained their rent growth and even saw further rent growth after January 2021, others saw rents fall as residents returned to their original location. This is particularly true for areas neighboring big cities where people left town temporarily and returned after the vaccine rollout began. The best example of this is Newark, NJ. Located just across the Hudson River from New York City, Newark rent rose by a whopping 31.6 percent between March 2020 and January 2021. But rent in Newark fell so rapidly after the vaccine rollout that today it’s now down 6 percent compared to March 2020. Newark’s rise and fall in rent inversely coincides with New York City’s fall and rise in rent.
A contraction for these types of cities after the vaccine is hardly surprising. Of those who moved, 16.1 percent of respondents to Zumper’s housing sentiment survey said they regret moving because they miss city life. While the Delta variant of COVID-19 certainly has the potential to delay a return to normal for urban cities, the survey shows clear interest in city life from a key demographic — young people. Those aged 18 to 29 accounted for 52.1 percent of respondents who moved from suburban areas to urban areas, and 14.7 percent said the pandemic made them more likely to live in a big city, the highest percentage of any age bracket.
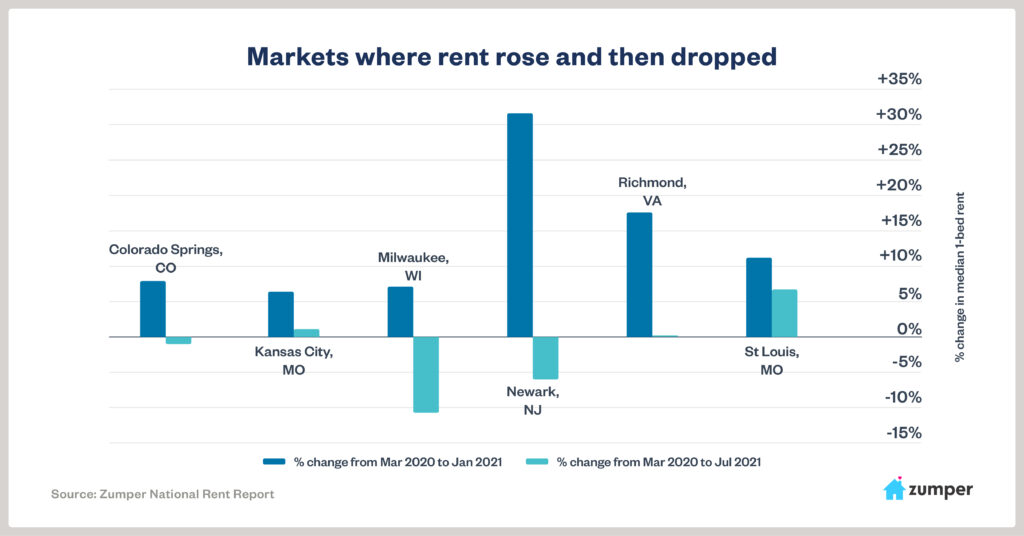
Colorado Springs, which likely took on residents from Denver after the pandemic and is also a tourist destination, saw rent rise 7.9 percent between March 2020 and January 2021, but now is down 0.9 percent relative to March 2020. Richmond, VA, rent was up 17.6 percent in January and is now exactly the same rent as it was in March 2020. This is the inverse of nearby Washington, DC. But the trend of rising rent after the pandemic and falling rent after the vaccine isn’t limited to Newark, or even cities that are satellites to bigger cities. Milwaukee rent was up 7.1 percent in January 2021 but is now down a staggering 10.7 percent relative to March 2020. St. Louis was up 11.2 percent in January but has dropped a bit and is now up 6.7 percent.
Some markets have been red hot throughout the pandemic
On a national scale, rent has risen substantially since the beginning of the pandemic. Zumper’s national index shows one-bedroom median rent up 6.6 percent since March 2020, while two-bedrooms are up 8.8 percent. While those numbers are incredible, they pale in comparison to some of the hottest markets in the country. Of the 100 most populous cities, Zumper has identified 29 as having risen consistently and rapidly over the course of the pandemic. Some of these are the satellite cities to big cities where rent has stayed down, such as Spokane, WA, where rent is up 21.3 percent since the pandemic. While Nashville rent remains down by 9 percent since March 2020, Chattanooga (28.9 percent) and Knoxville (15 percent) have experienced substantial rent growth over the same time period. Rent in Sacramento, slightly outside the Bay Area, is up 12.3 percent.
But other cities experiencing substantial rent growth are simply growing areas where the home sales market is scorching hot. Among respondents in Zumper’s housing survey, 41 percent say the pandemic made them value homeownership more, and 10.5 percent say they’re looking for homes now that they’re vaccinated, suggesting that there’s another wave of migration forming. The pandemic triggered an unexpected rush in the housing market, creating intense competition for homebuyers that’s driven prices up at a stunning rate. The steep rise in competition and prices has an effect on the local rental market as well. Aside from people who live with friends or family, households have one of two choices for their living arrangement: rent or own. And when owning gets more out of reach, it leaves people renting who would otherwise buy. This adds demand to rental housing and drives up rent.
The Phoenix metro area, which has grown in population rapidly over the last 10 years, is a prime example of this. While the sales market is on fire, rent since March 2020 in Phoenix (up 16.3 percent), Chandler (15.1 percent), Gilbert (20.3 percent), Glendale (22.6 percent), Mesa (13.4 percent), and Tucson (14.3 percent) have shot up. Las Vegas (12.6 percent) and Henderson (22.7 percent) have experienced the same phenomenon.
Other patterns in rent from across the country
While many cities have seen rent rise throughout the pandemic, others have seen rent rise in only one of the two halves of the pandemic — between March 2020 and January 2021, or between January 2021 and July 2021. Zumper identifies 18 cities as having stayed flat through January but have since risen substantially. There could be a number of reasons for this pattern. One is that lockdowns may have kept local residents in place until after the new year began, or that rent rises are more tied to the local sales market, which took time to trickle down to rent. Plano, TX, was up 0.9 percent in January relative to March 2020, but is now up 11 percent. Reno, NV, saw some modest growth through January at 2.9 percent, but then exploded to 16.4 percent after the new year. Three cities in Southern California followed this pattern as well, which is likely a result of the area’s more strict lockdowns. Anaheim, San Diego, and Santa Ana were flat through January before rising by 4.2 percent, 8.9 percent, and 5.9 percent, respectively.
Rent in six cities followed the mirror image of this pattern, rising between March 2020 and January 2021, then flattening out. This pattern could be attributed to being areas that absorbed movers in the immediate aftermath of the pandemic and have retained those residents. Durham, NC, and Greensboro, NC, saw rent spike by 23.2 percent and 15.28 percent, respectively, through January, but haven’t moved nearly as much since. Two cities — Arlington, TX, (10.5 percent) and Lexington, KY, (4.1 percent) — saw rent rises through January, but have yet to move in 2021.
| City | 3/20 Rent | 1/21 Rent | 7/21 Rent | % 3/20 to 1/21 | % 3/20 to 7/21 |
|---|---|---|---|---|---|
| San Francisco, CA | $3,500 | $2,680 | $2,720 | -23.40% | -22.30% |
| New York, NY | $2,850 | $2,350 | $2,680 | -17.50% | -6.00% |
| Boston, MA | $2,500 | $2,020 | $2,300 | -19.20% | -8.00% |
| San Jose, CA | $2,550 | $2,130 | $2,170 | -16.50% | -14.90% |
| Washington, DC | $2,230 | $1,960 | $2,060 | -12.10% | -7.60% |
| Los Angeles, CA | $2,250 | $1,940 | $2,000 | -13.80% | -11.10% |
| Oakland, CA | $2,400 | $2,000 | $2,000 | -16.70% | -16.70% |
| San Diego, CA | $1,800 | $1,800 | $1,960 | 0.00% | 8.90% |
| Miami, FL | $1,780 | $1,600 | $1,790 | -10.10% | 0.60% |
| Santa Ana, CA | $1,690 | $1,700 | $1,790 | 0.60% | 5.90% |
| Fort Lauderdale, FL | $1,700 | $1,690 | $1,730 | -0.60% | 1.80% |
| Anaheim, CA | $1,650 | $1,660 | $1,720 | 0.60% | 4.20% |
| Scottsdale, AZ | $1,490 | $1,500 | $1,680 | 0.70% | 12.80% |
| Atlanta, GA | $1,450 | $1,480 | $1,600 | 2.10% | 10.30% |
| Long Beach, CA | $1,590 | $1,600 | $1,600 | 0.60% | 0.60% |
| Seattle, WA | $1,820 | $1,560 | $1,600 | -14.30% | -12.10% |
| Gilbert, AZ | $1,280 | $1,340 | $1,540 | 4.70% | 20.30% |
| Providence, RI | $1,270 | $1,460 | $1,500 | 15.00% | 18.10% |
| Urban Honolulu, HI | $1,620 | $1,460 | $1,470 | -9.90% | -9.30% |
| Denver, CO | $1,490 | $1,400 | $1,460 | -6.00% | -2.00% |
| Sacramento, CA | $1,300 | $1,400 | $1,460 | 7.70% | 12.30% |
| Chandler, AZ | $1,260 | $1,330 | $1,450 | 5.60% | 15.10% |
| Chicago, IL | $1,500 | $1,540 | $1,430 | 2.70% | -4.70% |
| New Orleans, LA | $1,420 | $1,420 | $1,400 | 0.00% | -1.40% |
| Portland, OR | $1,400 | $1,400 | $1,400 | 0.00% | 0.00% |
| Orlando, FL | $1,280 | $1,240 | $1,390 | -3.10% | 8.60% |
| Baltimore, MD | $1,200 | $1,180 | $1,370 | -1.70% | 14.20% |
| Henderson, NV | $1,100 | $1,300 | $1,350 | 18.20% | 22.70% |
| Philadelphia, PA | $1,500 | $1,350 | $1,350 | -10.00% | -10.00% |
| St Petersburg, FL | $1,090 | $1,210 | $1,350 | 11.00% | 23.90% |
| Cleveland, OH | $940 | $1,150 | $1,340 | 22.30% | 42.60% |
| Charlotte, NC | $1,200 | $1,220 | $1,310 | 1.70% | 9.20% |
| Dallas, TX | $1,250 | $1,220 | $1,310 | -2.40% | 4.80% |
| Nashville, TN | $1,440 | $1,300 | $1,310 | -9.70% | -9.00% |
| Plano, TX | $1,180 | $1,190 | $1,310 | 0.80% | 11.00% |
| Austin, TX | $1,280 | $1,200 | $1,300 | -6.30% | 1.60% |
| Boise, ID | $1,030 | $1,150 | $1,280 | 11.70% | 24.30% |
| Tampa, FL | $1,120 | $1,200 | $1,280 | 7.10% | 14.30% |
| Newark, NJ | $1,330 | $1,750 | $1,250 | 31.60% | -6.00% |
| Madison, WI | $1,110 | $1,070 | $1,220 | -3.60% | 9.90% |
| Reno, NV | $1,040 | $1,070 | $1,210 | 2.90% | 16.30% |
| Virginia Beach, VA | $1,000 | $1,130 | $1,210 | 13.00% | 21.00% |
| Durham, NC | $950 | $1,170 | $1,200 | 23.20% | 26.30% |
| Irving, TX | $1,120 | $1,100 | $1,180 | -1.80% | 5.40% |
| Minneapolis, MN | $1,390 | $1,300 | $1,180 | -6.50% | -15.10% |
| Chattanooga, TN | $900 | $1,000 | $1,160 | 11.10% | 28.90% |
| Aurora, CO | $1,100 | $1,110 | $1,150 | 0.90% | 4.50% |
| Fresno, CA | $1,040 | $1,100 | $1,150 | 5.80% | 10.60% |
| Houston, TX | $1,120 | $1,100 | $1,140 | -1.80% | 1.80% |
| Phoenix, AZ | $980 | $1,010 | $1,140 | 3.10% | 16.30% |
| Raleigh, NC | $1,020 | $1,050 | $1,120 | 2.90% | 9.80% |
| Mesa, AZ | $970 | $1,020 | $1,100 | 5.20% | 13.40% |
| Pittsburgh, PA | $1,090 | $1,080 | $1,100 | -0.90% | 0.90% |
| Salt Lake City, UT | $1,110 | $1,070 | $1,100 | -3.60% | -0.90% |
| Fort Worth, TX | $1,060 | $1,080 | $1,090 | 1.90% | 2.80% |
| Richmond, VA | $1,080 | $1,270 | $1,080 | 17.60% | 0.00% |
| Las Vegas, NV | $950 | $1,000 | $1,070 | 5.30% | 12.60% |
| Rochester, NY | $920 | $1,010 | $1,070 | 9.80% | 16.30% |
| Buffalo, NY | $1,100 | $1,050 | $1,050 | -4.50% | -4.50% |
| Chesapeake, VA | $1,110 | $1,090 | $1,050 | -1.80% | -5.40% |
| Glendale, AZ | $840 | $910 | $1,030 | 8.30% | 22.60% |
| Des Moines, IA | $900 | $890 | $1,020 | -1.10% | 13.30% |
| Colorado Springs, CO | $1,010 | $1,090 | $1,000 | 7.90% | -1.00% |
| Jacksonville, FL | $900 | $970 | $1,000 | 7.80% | 11.10% |
| Milwaukee, WI | $1,120 | $1,200 | $1,000 | 7.10% | -10.70% |
| Norfolk, VA | $920 | $980 | $1,000 | 6.50% | 8.70% |
| Anchorage, AK | $930 | $910 | $990 | -2.20% | 6.50% |
| San Antonio, TX | $850 | $950 | $980 | 11.80% | 15.30% |
| Spokane, WA | $800 | $880 | $970 | 10.00% | 21.30% |
| Arlington, TX | $860 | $950 | $950 | 10.50% | 10.50% |
| Kansas City, MO | $940 | $1,000 | $950 | 6.40% | 1.10% |
| St Louis, MO | $890 | $990 | $950 | 11.20% | 6.70% |
| Bakersfield, CA | $810 | $850 | $930 | 4.90% | 14.80% |
| Columbus, OH | $810 | $860 | $930 | 6.20% | 14.80% |
| Indianapolis, IN | $820 | $940 | $930 | 14.60% | 13.40% |
| Knoxville, TN | $800 | $840 | $920 | 5.00% | 15.00% |
| Cincinnati, OH | $900 | $930 | $900 | 3.30% | 0.00% |
| Lincoln, NE | $770 | $790 | $890 | 2.60% | 15.60% |
| Louisville, KY | $840 | $870 | $890 | 3.60% | 6.00% |
| Omaha, NE | $830 | $800 | $860 | -3.60% | 3.60% |
| Augusta, GA | $760 | $820 | $850 | 7.90% | 11.80% |
| Memphis, TN | $760 | $830 | $850 | 9.20% | 11.80% |
| Syracuse, NY | $830 | $840 | $850 | 1.20% | 2.40% |
| Corpus Christi, TX | $830 | $850 | $840 | 2.40% | 1.20% |
| Winston Salem, NC | $770 | $800 | $840 | 3.90% | 9.10% |
| Baton Rouge, LA | $800 | $800 | $830 | 0.00% | 3.80% |
| Detroit, MI | $700 | $900 | $810 | 28.60% | 15.70% |
| Greensboro, NC | $720 | $830 | $810 | 15.30% | 12.50% |
| Tallahassee, FL | $830 | $800 | $800 | -3.60% | -3.60% |
| Tucson, AZ | $700 | $730 | $800 | 4.30% | 14.30% |
| Oklahoma City, OK | $760 | $770 | $790 | 1.30% | 3.90% |
| Albuquerque, NM | $710 | $740 | $760 | 4.20% | 7.00% |
| Lexington, KY | $730 | $760 | $760 | 4.10% | 4.10% |
| El Paso, TX | $680 | $710 | $750 | 4.40% | 10.30% |
| Laredo, TX | $750 | $650 | $740 | -13.30% | -1.30% |
| Shreveport, LA | $630 | $660 | $690 | 4.80% | 9.50% |
| Tulsa, OK | $630 | $640 | $690 | 1.60% | 9.50% |
| Lubbock, TX | $640 | $650 | $670 | 1.60% | 4.70% |
| Akron, OH | $610 | $600 | $640 | -1.60% | 4.90% |
| Wichita, KS | $660 | $610 | $610 | -7.60% | -7.60% |
Survey Methodology: Zumper polled 2,090 U.S. residents over the age of 18 on July 22, 2021, using Survey Monkey. The age distribution of respondents reflects that of Census data.
Related content


