Home to a river that flows backwards, amazing jazz music, and the first Twinkie ever created, Illinois holds a significant part of America’s rich history. If you’re thinking about moving here, this Illinois Rent Report will give you insight on state trends by highlighting the most affordable cities, showing which metro cities are growing the fastest, and comparing the most populous cities on rent price and growth rates.
The Most Expensive Cities

-Chicago & West Chicago
Tied for the most expensive city in Illinois to rent, Chicago and West Chicago both have a median one bedroom rent of $1,980, which is a whopping $1,090 more expensive than the $890 state median.
-Glenview
Only $30 behind Chicago and West Chicago, Glenview is second on this list of most expensive cities in Illinois, with a median one bedroom rent of $1,950.
-Algonquin
With a median rent of $1,710, Algonquin is the third most expensive city in Illinois to rent. It is $820 more expensive than the state median.
The Least Expensive Cities

-Freeport
With a median rent of $400, the least expensive, and most affordable, city to rent in Illinois is Freeport. The rent in Freeport is $490 less expensive than the state median and a staggering $1,580 less expensive than Chicago and West Chicago’s.
-Decatur
With a median one bedroom rent only $30 more than Freeport, Decatur is the second least expensive city to rent in Illinois. It’s median rent of $430 is currently $460 less expensive than the state median.
-Alton
Alton is the third least expensive city in Illinois with a median rent of $450, which is currently $440 less expensive than the state median.
Cities With The Fastest Growing Rents

-Arlington Heights
With a median growth rate of 10.9% since last quarter, Arlington Heights is currently the fastest growing city in Illinois, outpacing the 1.1% state median by an incredible margin. The median one bedroom rent here is $1,220, up $130 from last quarter.
-Westmont
Close behind Arlington heights, Westmont has the second fastest growing one bedroom rent in Illinois, at 10.7%. The median one bedroom rent is currently $930, up $100 from last quarter.
-Tinley Park
As the third fastest growing city in Illinois, Tinley Park has a growth rate of 9.8%. The one bedroom rent here is currently $1,010, up $100 from last quarter.
Growth Comparison Of The Most Populated Cities

-Waukegan
With a growth rate at 4.3%, Waukegan is the fastest growing city among the most populous Illinois cities.
-Naperville
With a growth rate at -5.8%, Naperville’s median rent has the slowest growth rate among the most populous Illinois cities.
-Chicago
As the most populous city in Illinois, Chicago continued to grow 3.1% since last quarter, which is slightly above the state median growth rate. According to our most recent national rent report, Chicago is still ranked as the 7th most expensive city to rent in the U.S.
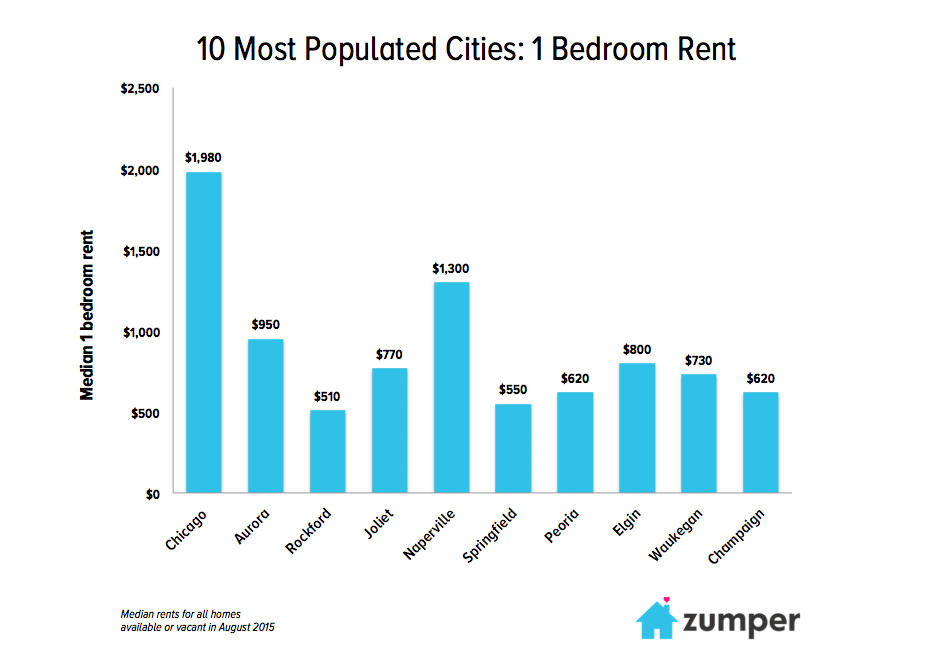
Rent Price Comparison Of The Most Populated Cities

Highlights
Compared to the rest of the most populous cities, Chicago’s median rent stands out as significantly more expensive than the rest. Naperville is the second most expensive city on this list and its rent is still $680 less expensive than Chicago. Aurora, the second most populous city in Illinois, has a median rent that is over $1,000 less expensive than Chicago’s.
Seven of the ten most populous cities in Illinois have rents below the state median’s, so affordability does exist in the larger regions here.
Full Data
| 1 Bedroom | 2 Bedrooms | ||||||
|---|---|---|---|---|---|---|---|
| Pos. | City | Price | M/M % | Q/Q% | Price | M/M % | Q/Q% |
| 1 | Chicago, IL | $1,980 | 3.10% | 3.10% | $2,650 | 3.50% | 3.50% |
| 1 | West Chicago, IL | $1,980 | 1.50% | 3.10% | $2,160 | -5.30% | -6.90% |
| 3 | Glenview, IL | $1,950 | 2.60% | 3.20% | $2,090 | -9.50% | -12.90% |
| 4 | Algonquin, IL | $1,710 | 0.00% | 1.80% | $1,770 | 2.30% | 4.10% |
| 5 | Highland Park, IL | $1,520 | 0.70% | 1.30% | $1,790 | 3.50% | 8.50% |
| 6 | Mundelein, IL | $1,430 | 5.90% | 5.90% | $1,520 | -2.60% | -5.00% |
| 7 | Naperville, IL | $1,300 | 0.80% | -5.80% | $1,500 | 0.00% | 0.00% |
| 8 | Arlington Heights, IL | $1,220 | 1.70% | 10.90% | $1,520 | 2.70% | 10.10% |
| 8 | Oak Park, IL | $1,220 | -1.60% | -11.60% | $1,770 | 5.40% | 1.10% |
| 10 | Northbrook, IL | $1,210 | 3.40% | 5.20% | $1,790 | 4.70% | 11.90% |
| 11 | Hoffman Estates, IL | $1,200 | 0.00% | 0.00% | $1,330 | 1.50% | 3.90% |
| 12 | Wilmette, IL | $1,150 | 0.00% | 1.80% | $1,960 | -4.40% | 3.20% |
| 13 | Buffalo Grove, IL | $1,140 | -0.90% | 8.60% | $1,640 | -1.20% | -0.60% |
| 14 | Gurnee, IL | $1,130 | 0.00% | 0.90% | $1,370 | -1.40% | 1.50% |
| 15 | Saint Charles, IL | $1,120 | 0.00% | 0.00% | $1,390 | 0.00% | 0.70% |
| 16 | Oswego, IL | $1,090 | 4.80% | 9.00% | $1,380 | -4.80% | -4.80% |
| 17 | Woodridge, IL | $1,080 | -8.50% | -4.40% | $1,320 | 7.30% | 5.60% |
| 18 | Lombard, IL | $1,060 | -2.80% | -8.60% | $1,440 | 3.60% | 6.70% |
| 19 | Skokie, IL | $1,050 | 0.00% | -1.90% | $1,330 | 0.80% | -8.30% |
| 19 | Wheaton, IL | $1,050 | -3.70% | -4.50% | $1,330 | -2.90% | -8.30% |
| 21 | Rolling Meadows, IL | $1,040 | -4.60% | -5.50% | $1,320 | 0.80% | -0.80% |
| 22 | Huntley, IL | $1,020 | 1.00% | 1.00% | $1,500 | 4.90% | 8.70% |
| 23 | Tinley Park, IL | $1,010 | 1.00% | 9.80% | $1,310 | 1.60% | -1.50% |
| 24 | Park Ridge, IL | $1,000 | 2.00% | 2.00% | $1,520 | 0.00% | -7.30% |
| 25 | Carpentersville, IL | $990 | 0.00% | 1.00% | $1,340 | 3.90% | 0.80% |
| 25 | Des Plaines, IL | $990 | -2.00% | -4.80% | $1,460 | 3.50% | 2.10% |
| 27 | Downers Grove, IL | $980 | 0.00% | 8.90% | $1,490 | 5.70% | 10.40% |
| 27 | Mount Prospect, IL | $980 | -1.00% | 4.30% | $1,240 | -2.40% | -0.80% |
| 29 | Crystal Lake, IL | $960 | 1.10% | 6.70% | $1,240 | 0.00% | -0.80% |
| 30 | Elk Grove Village, IL | $950 | -3.10% | -2.10% | $1,500 | 2.00% | 7.10% |
| 30 | Aurora, IL | $950 | -7.80% | -5.00% | $1,370 | 1.50% | 0.70% |
| 32 | Elmwood Park, IL | $940 | -1.10% | 1.10% | $1,190 | 6.30% | 5.30% |
| 32 | Palatine, IL | $940 | -1.10% | -2.10% | $1,280 | 2.40% | 2.40% |
| 34 | Westmont, IL | $930 | 9.40% | 10.70% | $1,440 | -4.00% | -4.00% |
| 34 | Niles, IL | $930 | 5.70% | 9.40% | $1,340 | 1.50% | -0.70% |
| 36 | Lake In The Hills, IL | $900 | 3.40% | 4.70% | $1,240 | -3.10% | -8.10% |
| 36 | Carol Stream, IL | $900 | -1.10% | 0.00% | $1,360 | 2.30% | 0.70% |
| 36 | Elmhurst, IL | $900 | 1.10% | -3.20% | $1,570 | 6.80% | -1.90% |
| 39 | Oak Lawn, IL | $890 | 3.50% | 1.10% | $1,220 | 6.10% | 1.70% |
| 39 | Glendale Heights, IL | $890 | 1.10% | 1.10% | $1,150 | -2.50% | -4.20% |
| 39 | Glen Ellyn, IL | $890 | -1.10% | -1.10% | $1,290 | -0.80% | -6.50% |
| 42 | Wheeling, IL | $880 | 0.00% | 0.00% | $1,420 | -2.10% | 1.40% |
| 43 | Berwyn, IL | $860 | 3.60% | 3.60% | $1,120 | 0.90% | 1.80% |
| 43 | Lockport, IL | $860 | 1.20% | 2.40% | $1,360 | -8.70% | -9.30% |
| 43 | Batavia, IL | $860 | -9.50% | -20.40% | $1,080 | 8.00% | 2.90% |
| 46 | Mchenry, IL | $850 | 1.20% | 4.90% | $1,230 | 1.70% | 8.80% |
| 46 | Oak Forest, IL | $850 | -1.20% | 0.00% | $1,320 | -2.90% | -9.00% |
| 48 | Woodstock, IL | $810 | 0.00% | 0.00% | $970 | 1.00% | -1.00% |
| 49 | Melrose Park, IL | $800 | 0.00% | 1.30% | $1,030 | 1.00% | 2.00% |
| 49 | Elgin, IL | $800 | -7.00% | -2.40% | $1,350 | 8.00% | 8.00% |
| 51 | North Chicago, IL | $790 | 1.30% | 8.20% | $1,160 | -1.70% | -1.70% |
| 52 | Joliet, IL | $770 | 4.10% | 4.10% | $930 | 0.00% | -2.10% |
| 52 | Lansing, IL | $770 | 2.70% | 2.70% | $940 | 1.10% | 3.30% |
| 54 | Chicago Heights, IL | $740 | 2.80% | 2.80% | $970 | 5.40% | -11.80% |
| 55 | Waukegan, IL | $730 | 2.80% | 4.30% | $940 | 1.10% | -1.10% |
| 55 | Romeoville, IL | $730 | 1.40% | 2.80% | $1,410 | 1.40% | 8.50% |
| 57 | Round Lake Beach, IL | $720 | 0.00% | 2.90% | $1,000 | 0.00% | -2.90% |
| 58 | Normal, IL | $700 | 0.00% | -1.40% | $550 | 0.00% | 0.00% |
| 59 | Calumet City, IL | $680 | 4.60% | 1.50% | $900 | 4.70% | 4.70% |
| 60 | Harvey, IL | $660 | 1.50% | 3.10% | $720 | 2.90% | 2.90% |
| 61 | Zion, IL | $650 | 0.00% | 0.00% | $850 | 1.20% | 2.40% |
| 62 | Peoria, IL | $620 | -3.10% | -3.10% | $690 | -1.40% | -4.20% |
| 62 | Champaign, IL | $620 | -3.10% | -4.60% | $850 | 0.00% | 0.00% |
| 64 | Kankakee, IL | $610 | 1.70% | 3.40% | $790 | 3.90% | 8.20% |
| 64 | Edwardsville, IL | $610 | 1.70% | 1.70% | $800 | -1.20% | -5.90% |
| 66 | Granite City, IL | $600 | -1.60% | 0.00% | $680 | -2.90% | -2.90% |
| 66 | Bloomington, IL | $600 | 0.00% | 0.00% | $770 | -3.80% | -3.80% |
| 68 | Urbana, IL | $590 | -3.30% | -1.70% | $780 | -1.30% | -2.50% |
| 68 | Dekalb, IL | $590 | 1.70% | -6.30% | $820 | 3.80% | 0.00% |
| 70 | O'Fallon, IL | $570 | 1.80% | 3.60% | $710 | 6.00% | 1.40% |
| 71 | Springfield, IL | $550 | 0.00% | 0.00% | $710 | 1.40% | 4.40% |
| 71 | Moline, IL | $550 | 3.80% | 0.00% | $770 | 1.30% | -3.80% |
| 73 | Carbondale, IL | $520 | 4.00% | 4.00% | $680 | 1.50% | 3.00% |
| 73 | Belleville, IL | $520 | 0.00% | 0.00% | $730 | 2.80% | 4.30% |
| 75 | Collinsville, IL | $510 | 4.10% | 4.10% | $750 | 0.00% | 1.40% |
| 75 | Rockford, IL | $510 | 2.00% | 2.00% | $650 | 0.00% | 0.00% |
| 77 | Rock Island, IL | $490 | -3.90% | -3.90% | $730 | 4.30% | 4.30% |
| 78 | Alton, IL | $450 | -2.20% | -2.20% | $630 | -3.10% | -3.10% |
| 79 | Decatur, IL | $430 | -2.30% | 0.00% | $550 | -5.20% | -5.20% |
| 80 | Freeport, IL | $400 | -4.80% | -4.80% | $490 | -2.00% | -5.80% |
About Zumper
The Zumper State Report analyzed rental data from over 30,000 active listings across Illinois in September. Data is aggregated on a monthly basis to calculate median asking rents.
In the market for a new place? Search all available Illinois apartments on Zumper.
Keep updated on the latest Zumper news by following us on Facebook and Twitter.
Related content


