Sometimes when a major U.S. city gets too expensive or their respective satellite city starts sprouting new and alluring amenities, demand and price growth in the satellite cities could actually outpace that of the core cities. Looking at some major metropolitan areas, we used our data to see which major cities kept their popularity this past year and which satellite cities stole the spotlight.
Demand Growth
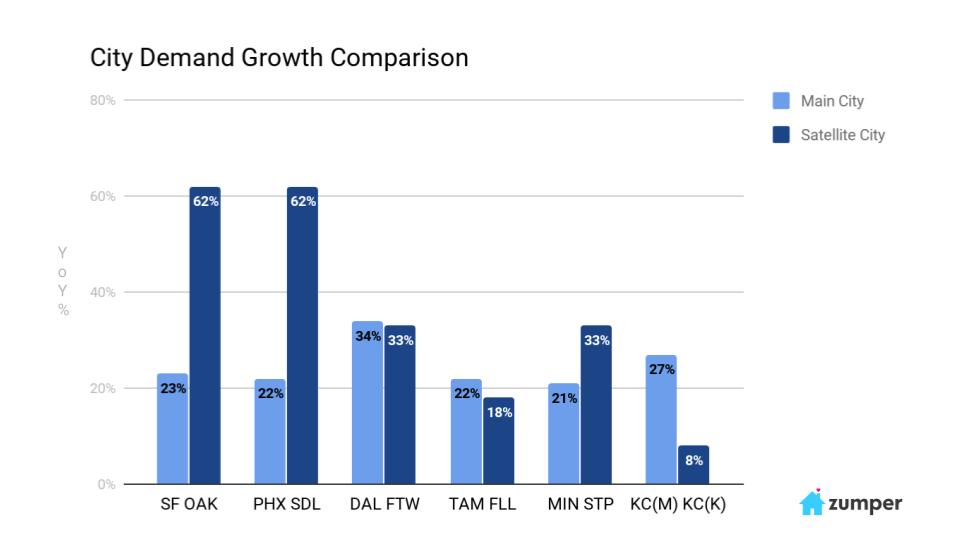
Satellite cities with larger demand growth
Oakland, CA saw a large 62% increase in demand from 2018 to 2019, while San Francisco’s demand grew 23%. As many renters are becoming priced out of the nation’s most expensive city, with one bedroom rent in San Francisco hovering around the $3,500 threshold, many have turned to more affordable satellite cities like Oakland to live.
Scottsdale, AZ, similar to Oakland, saw a year over year demand bump of 62%, shadowing Phoenix’s 22% growth. Offering a strong job market, affordability in terms of cost of living, and status as one of America’s top college towns, Scottsdale has become a very popular city to move to.
St. Paul, MN’s 33% year over year demand growth rate outpaced Minneapolis’ 21%, though both cities experienced a growing demand from thriving job markets and for housing with new construction becoming available. Since St. Paul’s median one bedroom rent is a bit cheaper than Minneapolis’, this most likely caused St Paul’s higher demand.
Main cities with larger demand growth
Dallas, TX‘s 34% year over year demand growth rate inched out Fort Worth’s by 1%. As this metro area has one of the nation’s fastest growing populations, the demand for housing has remained high.
Tampa, FL saw its demand grow 22% since 2018, while Fort Lauderdale’s growth rate was a few percentage points behind at 18%. These beachfront cities offer relatively affordable cost of livings and great amenities like temperate weather and tons of options for universities.
Kansas City, MO‘s year over year growth rate of 27% outpaced Kansas City, KS’s 8% by over 3x. Though these two cities both have very affordable rents, with one bedrooms priced under $1,000 a month, the Missouri side may have won in demand growth even with higher rents due to its lower income and sales taxes.
Price Growth
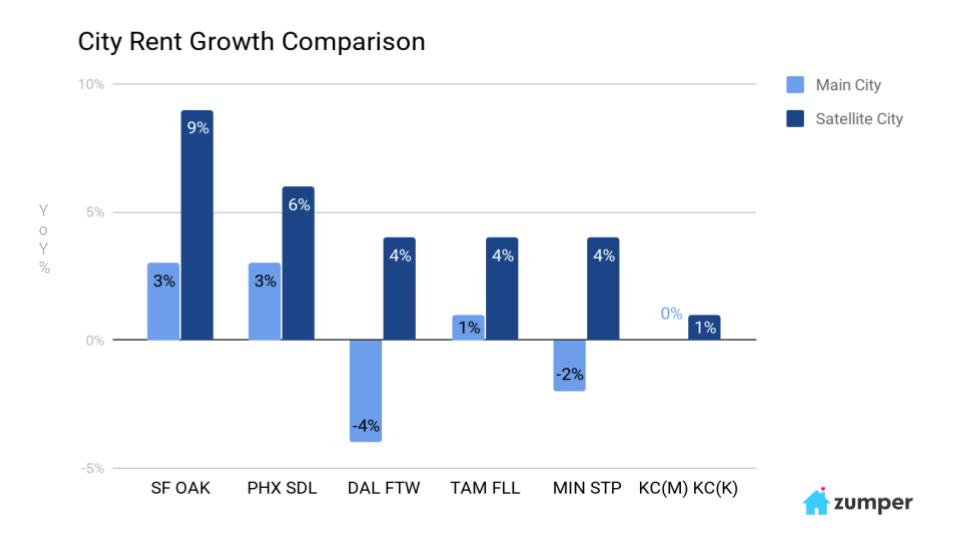
Notably, all satellite cities had larger year over year rental growth rates than their respective main cities and not every satellite city had less expensive rents.
Oakland’s year over year rent price growth rate outpaced San Francisco’s by 3x. Similarly, Scottsdale rental rates grew twice as fast as Phoenix’s. Dallas and Minneapolis rents both decreased in the past year, down -4% and -2%, respectively, while their respective satellite cities, Fort Worth and St. Paul, saw growth rates both up 4%. Meanwhile, the two Kansas Cities were both relatively flat in terms of year over year rent price changes.
Full Data
| City | 2019 1 Bed Median Price | Demand Y/Y % | Price Y/Y% |
|---|---|---|---|
| Dallas, TX | $1,233 | 34% | -4% |
| Fort Worth, TX | $1,109 | 33% | 4% |
| Kansas City, KS | $702 | 8% | 1% |
| Kansas City, MO | $947 | 27% | 0% |
| Minneapolis, MN | $1,393 | 21% | -2% |
| St. Paul, MN | $1,315 | 33% | 4% |
| San Francisco, CA | $3,603 | 23% | 3% |
| Oakland, CA | $2,366 | 62% | 9% |
| Phoenix, AZ | $989 | 22% | 3% |
| Scottsdale, AZ | $1,394 | 62% | 6% |
| Tampa, FL | $1,145 | 22% | 1% |
| Fort Lauderdale, FL | $1,607 | 18% | 4% |
Methodology
Using data on Zumper.com we looked at demand, which we defined as total number of messages sent, and one-bedroom median rent prices for each city. We compared data from the entirety of 2018 with data from the entirety of 2019 to gather year over year growth rates. The cities we looked at are available in the “Full Data” table.
Related content