New York City was the second most expensive rental market in the country last month with a median one-bedroom rent of $2,870. Though coming shy of first place San Francisco at $3,400, New York continues to command the highest priced neighborhoods in the country. In this edition of the Zumper New York Rent Report, we explore how rent prices changed across these neighborhoods and others around the city.
The 5 Most Expensive Rental Neighborhoods
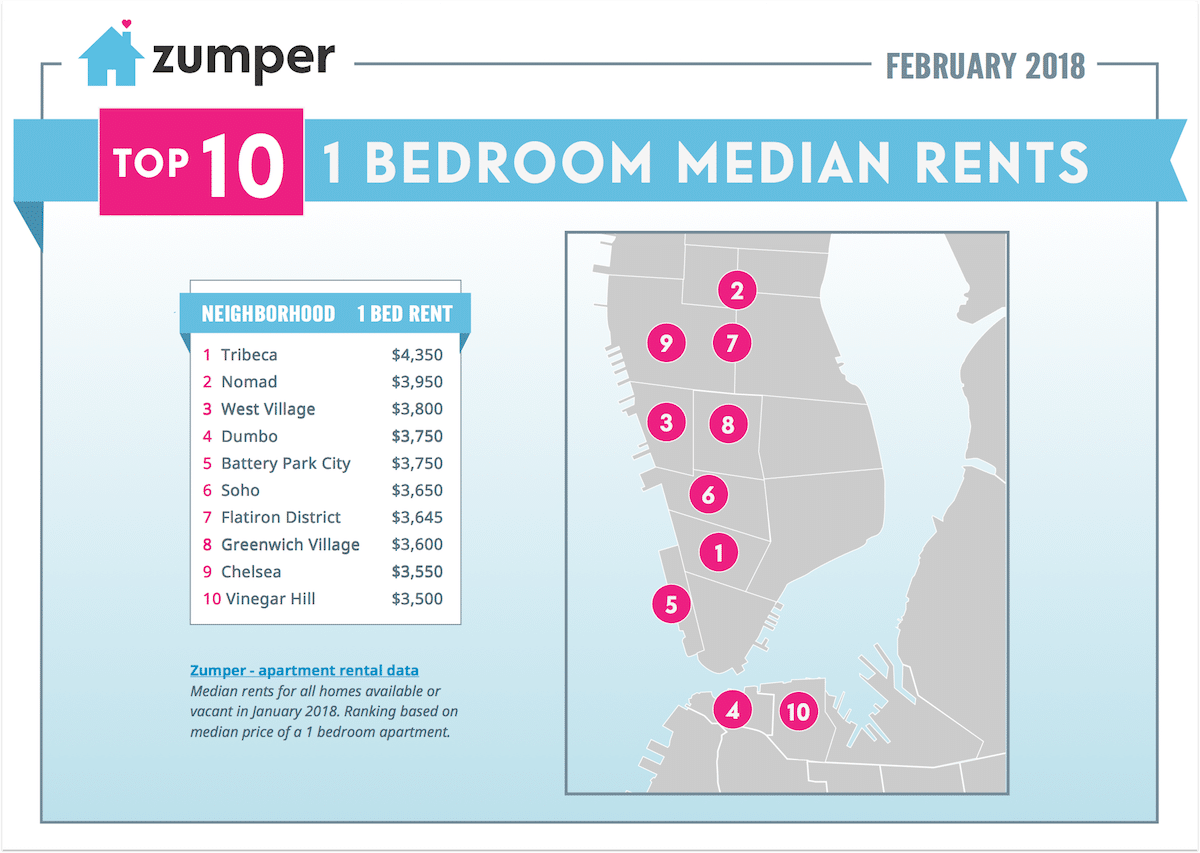
1. Tribeca was the most expensive neighborhood in NYC for renters last month, commanding a median one-bedroom of $4,350 and a median two-bedroom rent of $5,260. One-beds increased 2.6% in the month, however are down 5.1% from the same time last year.
2. Nomad came in second place on our list, as one-bedrooms rented for $3,950 and two-bedrooms for $5,860. Prices increased across both bedroom types in the past month.
3. West Village was a close third with one-bedroom and two-bedroom rents of $3,800 and $4,820, respectively.
4. DUMBO saw median one-bedrooms command $3,750, down 3.4% in the past month, yet up 2% overall in the past year. Two bedrooms saw an increase of 0.7% in the month to $5,070.
5. Battery Park City rounds out the top five, tying DUMBO at a median one-bedroom of $3,750. One bedrooms have seen prices drop in the past year, while two bedrooms have increased.
Notable Changes This Report
![]() Upward
Upward
– Midtown East experienced a surge in prices this January, led by one-bedrooms increasing 4.2% to $3,190. Two-bedrooms also jumped in the period, up 3.9% to $3,900. The neighborhood was the 17th most expensive in the city.
– Flatiron District saw one-bedrooms increase 3.5% to $3,645, and two bedrooms increase 1.2% to $4,275.
– Boerum Hill was the 30th most expensive neighborhood last month. Both one and two-bedroom median prices increased in the month, up 3.8% and 2.4%, respectively.
![]() Downward
Downward
– Chinatown dropped to the 34th most expensive neighborhood as both one and two-bedroom units saw rent prices decline in the month. Prices decreased 4.5% and 2.3% for one and two-bedroom units, respectively.
– Roosevelt Island saw one-bedroom medians decrease 4.9% to $2,495. Two-bedrooms also dipped 3.2% to $3,240.
– Bushwick was the 51st most expensive neighborhood, coming behind Bedford-Stuyvesant and West Harlem. Prices decreased 4.2% and 1.8% for one and two-bedrooms, respectively.
About
The Zumper New York Rent Report analyses rental data from over 50,000 active listings across New York City. Data is aggregated on a monthly basis to calculate median asking rents for each neighborhood, providing a comprehensive view of the current state of the market. The report is based on all data available in the month prior to publication.
If you’re interested in a more in-depth explanation of how and why we calculate our rent data, view our methodology post here.
To keep up to date with rent changes, like or follow Zumper on Facebook, Twitter, and Instagram. In the market for a new place in NYC? Search NYC apartments for rent on Zumper.
Median Rent Prices – Full Dataset
| 1 Bedroom | 2 Bedrooms | ||||||
|---|---|---|---|---|---|---|---|
| Pos. | City | Price | M/M % | Y/Y % | Price | M/M % | Y/Y % |
| 1 | Columbia | $1,560 | -3.70% | 6.80% | $1,830 | -2.10% | 15.80% |
| 2 | Ellicott City | $1,540 | 4.80% | 14.90% | $1,640 | 3.10% | 1.20% |
| 3 | Annapolis | $1,490 | -0.70% | 14.60% | $1,750 | 1.20% | 9.40% |
| 4 | Baltimore | $1,260 | 5.00% | 15.60% | $1,470 | 5.00% | 13.10% |
| 5 | Owings Mills | $1,180 | -1.70% | -5.60% | $1,430 | 0.70% | -1.40% |
| 5 | Pikesville | $1,180 | -4.80% | 15.70% | $1,390 | 2.20% | -4.10% |
| 7 | Glen Burnie | $1,130 | 3.70% | 2.70% | $1,440 | 1.40% | 10.80% |
| 8 | Towson | $1,100 | 0.00% | -12.70% | $1,460 | 0.00% | 6.60% |
| 9 | Lochearn | $990 | 5.30% | 7.60% | $1,090 | 3.80% | 4.80% |
| 10 | Parkville | $960 | -3.00% | -6.80% | $1,100 | 4.80% | -12.00% |
| 11 | Dundalk | $890 | 0.00% | 9.90% | $1,160 | 2.70% | 0.90% |
| 12 | Brooklyn Park | $850 | 3.70% | 13.30% | $1,060 | -5.40% | 1.00% |
Related content


