While the trend of plateauing prices continued in the top 10 markets this month, the rest of the country began to experience this as well. The only change in position in the most expensive markets was Honolulu, moving up one spot. Mid and lower tiered cities also saw one of the flattest months ever with a record number of cities with no monthly growth. With that being said, those less expensive cities still had the most volatile changes. Overall, with summer winding down, rents across the nation seem to be stabilizing.
Nationwide, the Zumper National Rent Index showed one and two bedroom median rent settling at $1,183 and $1,402, respectively.

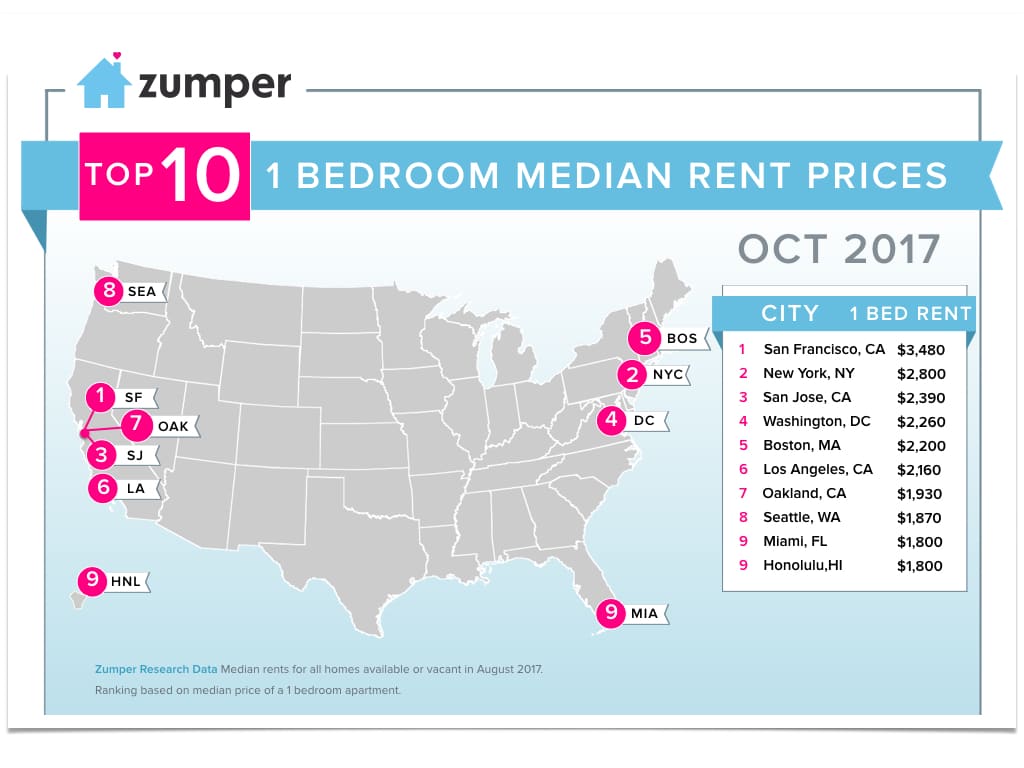
Top Five Rental Markets
1. San Francisco, CA rent, though growing 2.7% this month, remained below the $3,500 threshold at $3,480. Two bedroom rent, on the other hand, fell 1.3% to $4,500. This city remained the most expensive in the nation.
2. New York, NY, ranking as the second priciest city, saw rent for one bedrooms decrease 1.8% to $2,800, while two bedrooms dropped 3.1% to $3,100. On a year over year basis, two bedroom rent is down over 10%.
3. San Jose, CA continued to rank as third with one and two bedrooms settling at $2,390 and $2,760, respectively. One bedroom rent is up over 9% since this time last year.
4. Washington, DC was fourth with one bedroom rent dropping a slight 0.9% to $2,260 and two bedroom rent falling 1.5% to $3,180.
5. Boston, MA finished off the top 5 markets with flat one bedroom rent growth, staying at $2,200, and a 0.4% two bedroom growth rate, settling at $2,610.
Notable Changes This Month
![]() Upward
Upward
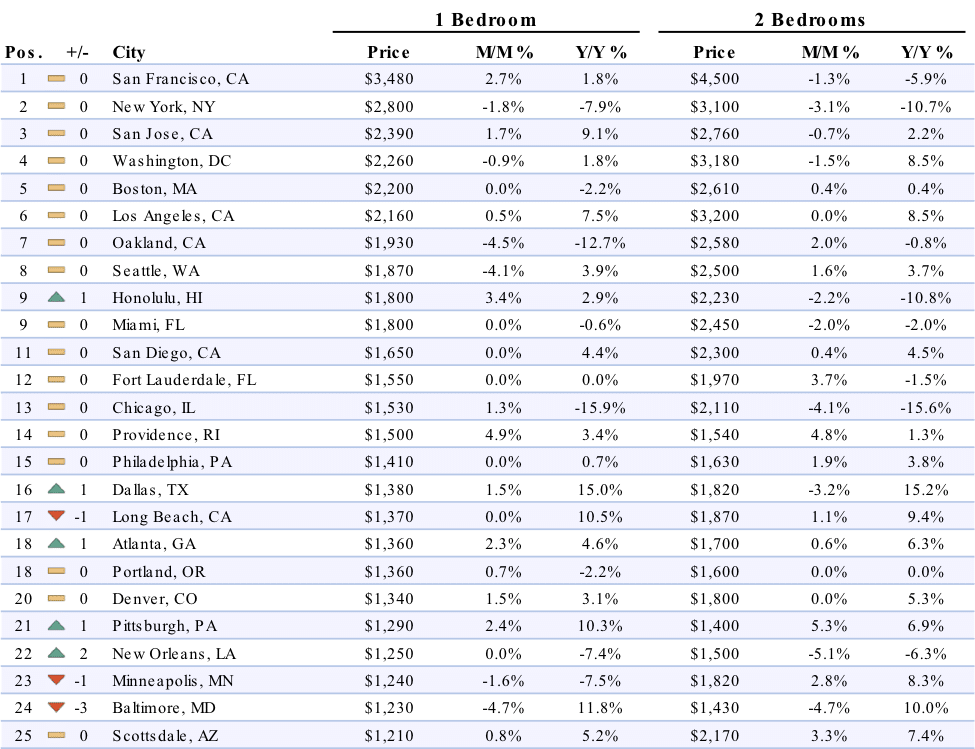
–Honolulu, HI was the only market in the top 15 cities to see any movement in the rankings this month, climbing one spot to become tied with Miami as the 9th most expensive city. One bedroom rent jumped 3.4% to $1,800, while two bedrooms decreased 2.2% to $2,230.
–Houston, TX jumped 3 spots to become the 29th priciest city this month with one bedroom rent growing 3.6% to $1,150. Two bedroom prices also saw a big increase, climbing 5.1% to $1,440.
–Newark, NJ saw one bedroom rent climb 4 spots and 3.1% this month, now settling as 36th and at $1,030. Two bedrooms here saw an even larger growth rate, up 4.2% to $1,250.
–Anchorage, AK rose four spots in the rankings this month to become the 46th most expensive city. One bedroom rent jumped 4.6% to $910.
–Milwaukee, WI rent climbed 8 spots to become the 54th priciest in the nation. One bedroom prices grew 5% to $840, while two bedroom rent had a more conservative growth rate, up 1.1% to $920.
![]() Downward
Downward
–Oakland, CA one bedroom rent had the largest decline in the top markets, decreasing 4.5% to $1,930, now well under the $2,000 threshold. Since this time last year, one bedroom rent is down 12.7%.
–Baltimore, MD fell 3 spots to become the 24th priciest city with both one and two bedroom rents falling 4.7%. One bedrooms settled at $1,230, while two bedrooms dropped to $1,430.
–Durham, NC dropped 4 spots to rank as 41st. One bedroom rent decreased 2.9% to $990 while two bedroom prices saw an even larger decline, falling 4.5% to $1,050.
–Fort Worth, TX saw one bedroom rent drop 4.1% to $930, becoming the 45th most expensive in the nation.
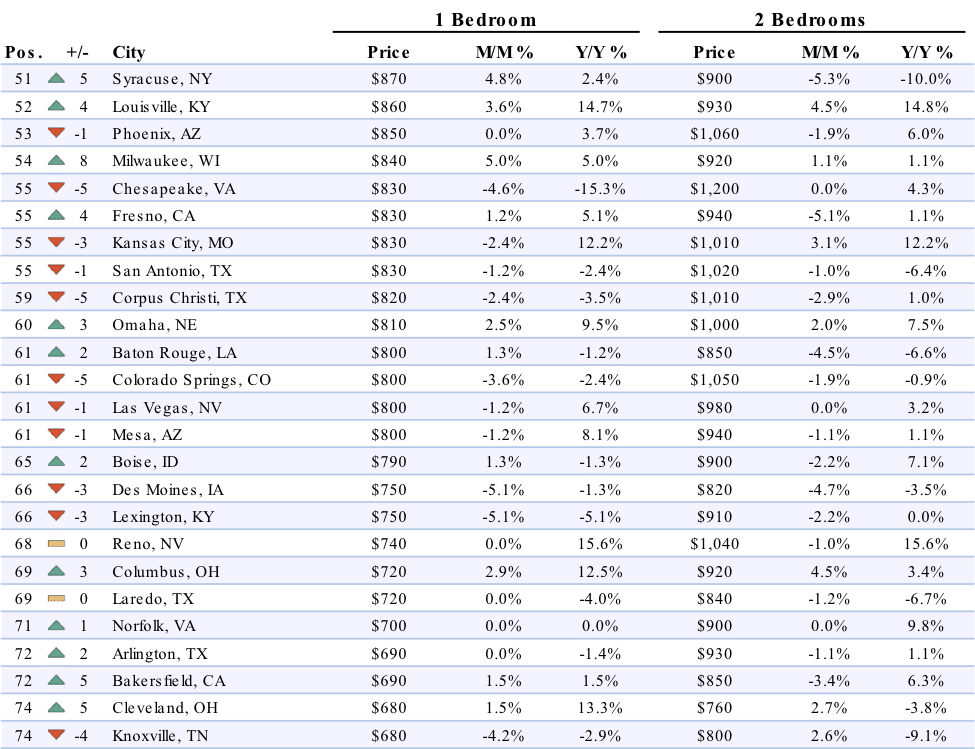
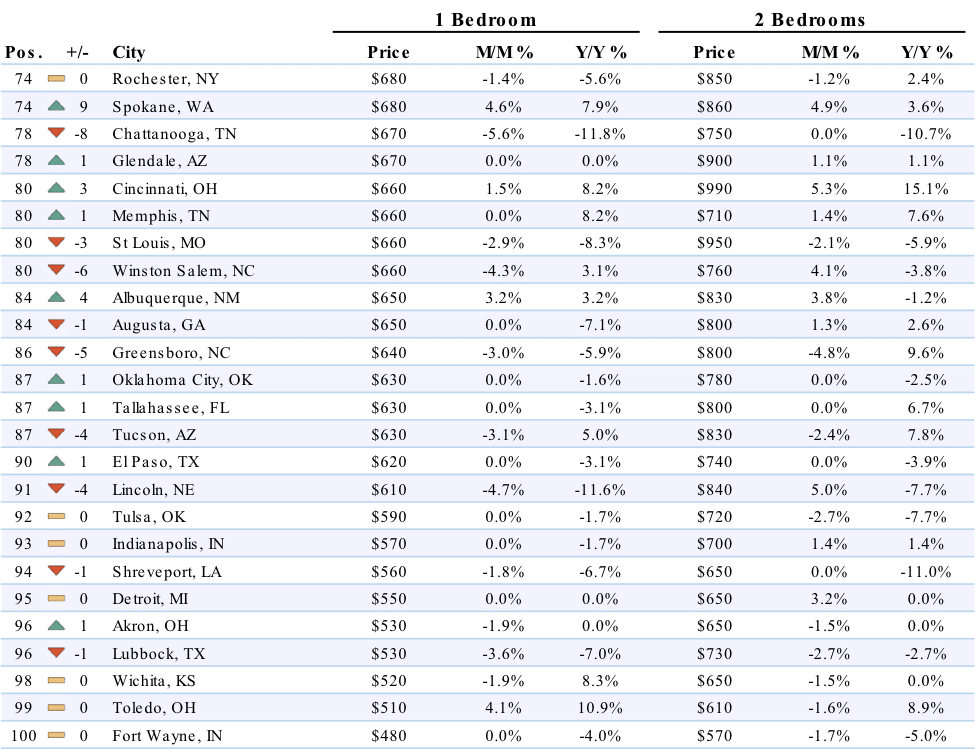
–Chattanooga, TN fell 8 positions to become the 78th priciest city. One bedroom rent dropped a staggering 5.6% to $670 while two bedroom prices remained flat at $750.
Full Data
| 1 Bedroom | 2 Bedrooms | ||||||
|---|---|---|---|---|---|---|---|
| Pos. | City | Price | M/M % | Y/Y % | Price | M/M % | Y/Y % |
| 1 | San Francisco, CA | $3,420 | -1.70% | 1.20% | $4,500 | 0.00% | -3.60% |
| 2 | New York, NY | $2,870 | 2.50% | -4.30% | $3,200 | 3.20% | -7.20% |
| 3 | San Jose, CA | $2,360 | -1.30% | 6.80% | $2,730 | -1.10% | 1.50% |
| 4 | Washington, DC | $2,290 | 1.30% | 5.00% | $3,140 | -1.30% | 11.30% |
| 5 | Boston, MA | $2,200 | 0.00% | -2.20% | $2,610 | 0.00% | 0.40% |
| 6 | Los Angeles, CA | $2,100 | -2.80% | 3.40% | $3,140 | -1.90% | 4.70% |
| 7 | Oakland, CA | $1,960 | 1.60% | -10.90% | $2,550 | -1.20% | -1.90% |
| 8 | Seattle, WA | $1,800 | -3.70% | -1.10% | $2,440 | -2.40% | -2.80% |
| 9 | Miami, FL | $1,750 | -2.80% | -2.80% | $2,430 | -0.80% | -2.80% |
| 10 | Honolulu, HI | $1,730 | -3.90% | 0.00% | $2,120 | -4.90% | -11.70% |
| 11 | San Diego, CA | $1,650 | 0.00% | 7.10% | $2,250 | -2.20% | 2.70% |
| 12 | Chicago, IL | $1,530 | 0.00% | -15.90% | $2,180 | 3.30% | -15.50% |
| 13 | Fort Lauderdale, FL | $1,520 | -1.90% | 0.70% | $1,950 | -1.00% | -2.50% |
| 14 | Providence, RI | $1,430 | -4.70% | 3.60% | $1,610 | 4.50% | 8.10% |
| 15 | Philadelphia, PA | $1,400 | -0.70% | 0.00% | $1,600 | -1.80% | 3.90% |
| 16 | Denver, CO | $1,390 | 3.70% | 10.30% | $1,750 | -2.80% | 4.20% |
| 17 | Atlanta, GA | $1,380 | 1.50% | 5.30% | $1,680 | -1.20% | 1.80% |
| 18 | Long Beach, CA | $1,360 | -0.70% | 4.60% | $1,870 | 0.00% | 3.90% |
| 19 | Portland, OR | $1,350 | -0.70% | -2.20% | $1,560 | -2.50% | -3.70% |
| 20 | Dallas, TX | $1,340 | -2.90% | 10.70% | $1,800 | -1.10% | 12.50% |
| 21 | New Orleans, LA | $1,310 | 4.80% | -12.10% | $1,480 | -1.30% | -11.40% |
| 22 | Scottsdale, AZ | $1,260 | 4.10% | 6.80% | $2,150 | -0.90% | 1.40% |
| 23 | Pittsburgh, PA | $1,230 | -4.70% | -7.50% | $1,330 | -5.00% | -3.60% |
| 24 | Madison, WI | $1,210 | 1.70% | -2.40% | $1,300 | 5.70% | -15.00% |
| 24 | Minneapolis, MN | $1,210 | -2.40% | -15.40% | $1,800 | -1.10% | -7.70% |
| 26 | Houston, TX | $1,200 | 4.30% | 15.40% | $1,500 | 4.20% | 15.40% |
| 27 | Nashville, TN | $1,180 | 0.90% | 9.30% | $1,300 | -3.00% | 3.20% |
| 28 | Baltimore, MD | $1,170 | -4.90% | 11.40% | $1,360 | -4.90% | 4.60% |
| 28 | Orlando, FL | $1,170 | 5.40% | 14.70% | $1,290 | 1.60% | 7.50% |
| 30 | Sacramento, CA | $1,150 | 2.70% | 15.00% | $1,350 | 0.70% | 14.40% |
| 31 | Irving, TX | $1,120 | -3.40% | 14.30% | $1,350 | -3.60% | 8.00% |
| 31 | Plano, TX | $1,120 | 0.00% | 4.70% | $1,490 | -0.70% | 3.50% |
| 33 | Charlotte, NC | $1,110 | -1.80% | 0.90% | $1,230 | -0.80% | 2.50% |
| 34 | Austin, TX | $1,100 | 0.90% | -5.20% | $1,380 | -0.70% | -6.80% |
| 35 | Tampa, FL | $1,060 | 1.00% | 6.00% | $1,250 | -1.60% | 6.80% |
| 36 | Gilbert, AZ | $1,050 | 5.00% | 11.70% | $1,360 | 3.00% | 14.30% |
| 37 | Virginia Beach, VA | $1,030 | 3.00% | 14.40% | $1,190 | -0.80% | 7.20% |
| 38 | Aurora, CO | $1,000 | 0.00% | 3.10% | $1,350 | -0.70% | 3.80% |
| 38 | Chandler, AZ | $1,000 | 2.00% | 8.70% | $1,220 | -0.80% | 8.90% |
| 38 | Newark, NJ | $1,000 | -2.90% | 11.10% | $1,200 | -4.00% | 9.10% |
| 41 | Durham, NC | $990 | 0.00% | 7.60% | $1,100 | 4.80% | 4.80% |
| 41 | Richmond, VA | $990 | -1.00% | 3.10% | $1,110 | -5.10% | 11.00% |
| 43 | Raleigh, NC | $970 | 0.00% | 5.40% | $1,080 | -0.90% | 0.00% |
| 44 | Fort Worth, TX | $940 | 1.10% | 3.30% | $1,200 | 3.40% | 8.10% |
| 44 | Henderson, NV | $940 | -1.10% | 0.00% | $1,110 | -0.90% | 1.80% |
| 46 | Buffalo, NY | $930 | 2.20% | -9.70% | $1,130 | -5.00% | -5.80% |
| 47 | Syracuse, NY | $910 | 4.60% | 9.60% | $950 | 5.60% | 0.00% |
| 48 | Anchorage, AK | $900 | -1.10% | 0.00% | $1,100 | 0.00% | -2.70% |
| 48 | Jacksonville, FL | $900 | 0.00% | 2.30% | $1,040 | -1.00% | -1.00% |
| 48 | Louisville, KY | $900 | 4.70% | 7.10% | $960 | 3.20% | 1.10% |
| 48 | St Petersburg, FL | $900 | -1.10% | 7.10% | $1,270 | -0.80% | -11.80% |
| 52 | Salt Lake City, UT | $890 | -1.10% | 3.50% | $1,250 | 3.30% | 13.60% |
| 53 | Chesapeake, VA | $860 | 3.60% | -15.70% | $1,180 | -1.70% | 3.50% |
| 53 | Corpus Christi, TX | $860 | 4.90% | 4.90% | $1,000 | -1.00% | 0.00% |
| 53 | Milwaukee, WI | $860 | 2.40% | 7.50% | $900 | -2.20% | 0.00% |
| 56 | Phoenix, AZ | $850 | 0.00% | 3.70% | $1,090 | 2.80% | 9.00% |
| 57 | Boise, ID | $830 | 5.10% | 10.70% | $930 | 3.30% | 12.00% |
| 57 | Fresno, CA | $830 | 0.00% | -5.70% | $990 | 5.30% | 4.20% |
| 57 | Kansas City, MO | $830 | 0.00% | 1.20% | $1,000 | -1.00% | 8.70% |
| 57 | San Antonio, TX | $830 | 0.00% | -4.60% | $1,020 | 0.00% | -8.10% |
| 61 | Baton Rouge, LA | $820 | 2.50% | -8.90% | $880 | 3.50% | -10.20% |
| 62 | Colorado Springs, CO | $800 | 0.00% | -7.00% | $1,100 | 4.80% | 4.80% |
| 62 | Las Vegas, NV | $800 | 0.00% | 6.70% | $980 | 0.00% | 3.20% |
| 62 | Mesa, AZ | $800 | 0.00% | 9.60% | $920 | -2.10% | -1.10% |
| 62 | Omaha, NE | $800 | -1.20% | 9.60% | $950 | -5.00% | 6.70% |
| 66 | Reno, NV | $780 | 5.40% | 11.40% | $1,090 | 4.80% | 13.50% |
| 67 | Laredo, TX | $760 | 5.60% | -1.30% | $880 | 4.80% | -3.30% |
| 68 | Cleveland, OH | $710 | 4.40% | 14.50% | $750 | -1.30% | -2.60% |
| 68 | Des Moines, IA | $710 | -5.30% | -11.30% | $820 | 0.00% | -3.50% |
| 68 | Lexington, KY | $710 | -5.30% | -5.30% | $900 | -1.10% | 1.10% |
| 68 | Rochester, NY | $710 | 4.40% | -2.70% | $850 | 0.00% | 0.00% |
| 68 | Spokane, WA | $710 | 4.40% | 9.20% | $860 | 0.00% | 8.90% |
| 73 | Chattanooga, TN | $700 | 4.50% | -4.10% | $770 | 2.70% | 4.10% |
| 74 | Arlington, TX | $690 | 0.00% | -1.40% | $930 | 0.00% | 2.20% |
| 74 | Bakersfield, CA | $690 | 0.00% | 6.20% | $860 | 1.20% | 7.50% |
| 76 | Cincinnati, OH | $680 | 3.00% | -9.30% | $970 | -2.00% | 10.20% |
| 76 | Columbus, OH | $680 | -5.60% | 13.30% | $970 | 5.40% | 5.40% |
| 76 | Knoxville, TN | $680 | 0.00% | -1.40% | $790 | -1.30% | -1.30% |
| 76 | Norfolk, VA | $680 | -2.90% | 0.00% | $890 | -1.10% | 7.20% |
| 80 | Glendale, AZ | $670 | 0.00% | -5.60% | $940 | 4.40% | 5.60% |
| 80 | Winston Salem, NC | $670 | 1.50% | -15.20% | $730 | -3.90% | -6.40% |
| 82 | St Louis, MO | $660 | 0.00% | -9.60% | $920 | -3.20% | -8.00% |
| 83 | Memphis, TN | $650 | -1.50% | 6.60% | $700 | -1.40% | 7.70% |
| 83 | Oklahoma City, OK | $650 | 3.20% | 3.20% | $790 | 1.30% | 1.30% |
| 85 | Albuquerque, NM | $640 | -1.50% | 1.60% | $820 | -1.20% | -3.50% |
| 86 | Greensboro, NC | $630 | -1.60% | -8.70% | $780 | -2.50% | 5.40% |
| 86 | Tallahassee, FL | $630 | 0.00% | -6.00% | $780 | -2.50% | 4.00% |
| 86 | Tucson, AZ | $630 | 0.00% | 3.30% | $800 | -3.60% | 3.90% |
| 89 | Augusta, GA | $620 | -4.60% | -15.10% | $770 | -3.80% | -2.50% |
| 90 | El Paso, TX | $600 | -3.20% | -6.30% | $740 | 0.00% | -2.60% |
| 90 | Indianapolis, IN | $600 | 5.30% | 5.30% | $720 | 2.90% | 5.90% |
| 90 | Lincoln, NE | $600 | -1.60% | -15.50% | $860 | 2.40% | -5.50% |
| 93 | Tulsa, OK | $590 | 0.00% | -1.70% | $720 | 0.00% | -5.30% |
| 94 | Shreveport, LA | $560 | 0.00% | -1.80% | $620 | -4.60% | -12.70% |
| 95 | Detroit, MI | $550 | 0.00% | 0.00% | $650 | 0.00% | 0.00% |
| 95 | Lubbock, TX | $550 | 3.80% | -5.20% | $700 | -4.10% | -4.10% |
| 97 | Akron, OH | $540 | 1.90% | 1.90% | $650 | 0.00% | 8.30% |
| 97 | Toledo, OH | $540 | 5.90% | 14.90% | $610 | 0.00% | 10.90% |
| 99 | Wichita, KS | $490 | -5.80% | 0.00% | $660 | 1.50% | 1.50% |
| 100 | Fort Wayne, IN | $470 | -2.10% | -4.10% | $550 | -3.50% | -8.30% |
About
The Zumper National Rent Report analyses rental data from over 1 million active listings across the United States. Data is aggregated on a monthly basis to calculate median asking rents for the top 100 metro areas by population, providing a comprehensive view of the current state of the market. The report is based on all data available in the month prior to publication.
If you’re interested in a more in-depth explanation of how and why we calculate our rent data, view our methodology post here.
To keep up to date with rent changes across the country, like or follow Zumper on Facebook, Twitter, and Instagram. In the market for a new place? Search apartments for rent on Zumper.
Related content