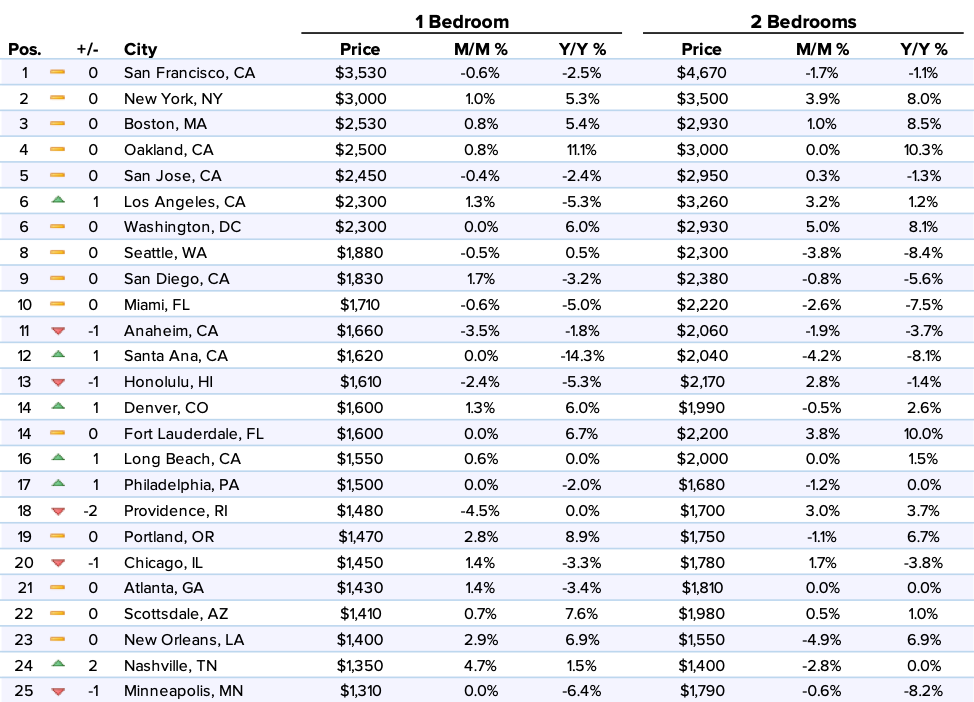
As we head into the slower moving season, the top 10 markets saw a relatively flat month with essentially no changes in the rankings. However on a year over year basis, San Francisco prices were down for both bedroom types while New York rents were both up, especially with two bedrooms where rent was up 8%.
Meanwhile, mid to low tiered cities saw more volatile changes as the cities experiencing the most upward and downward growth were located in these markets. #87 Bakersfield had the largest monthly growth rate, up 5.5%, while #84 Laredo saw the biggest rent dip, down 4.8%.
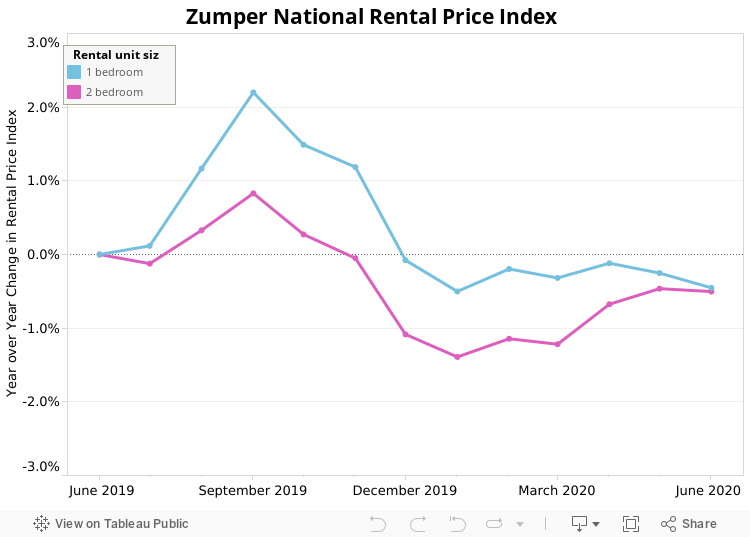
Overall, the national one and two bedroom rents both fell 0.3% last month to settle at medians of $1,237 and $1,480, respectively. On a year to date basis, one bedroom rent is up 2.5% and two bedroom rent is up 2.6%.
Top Five Rental Markets
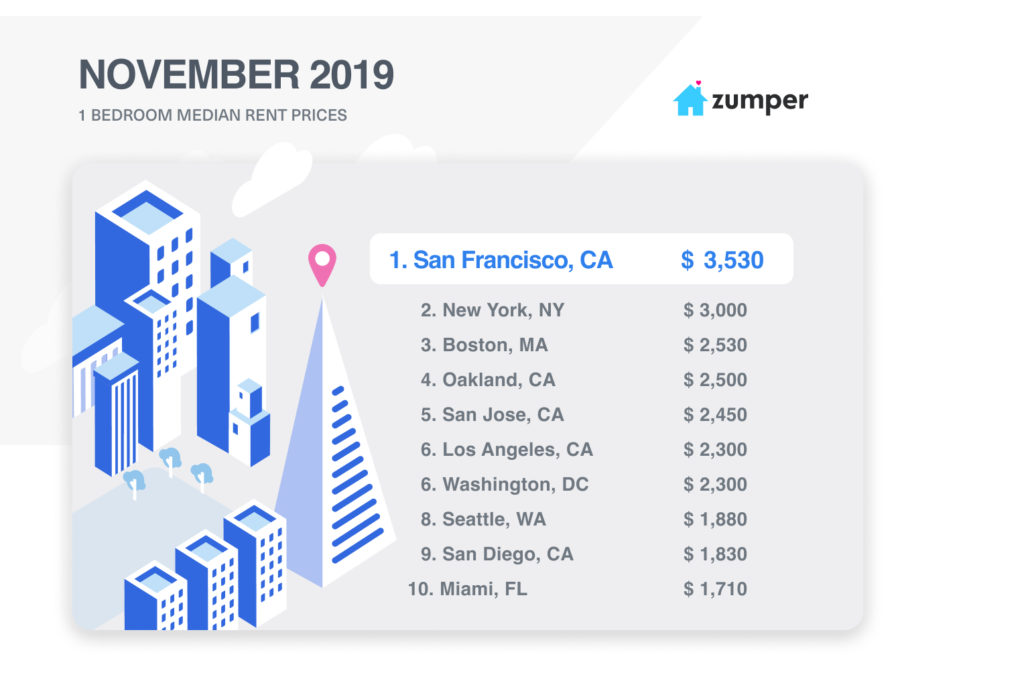
1. San Francisco, CA one bedroom rent decreased 0.6% to $3,530, while two bedrooms dropped 1.7% to $4,670.
2. New York, NY saw one bedroom rent inch up 1% to $3,000 and two bedrooms grow 3.9% to $3,500.
3. Boston, MA remained 3rd with one bedroom rent increasing 0.8% to $2,530, while two bedrooms climbed 1% to $2,930.
4. Oakland, CA followed closely behind as 4th with one bedroom rent growing 0.8% to $2,500, while two bedrooms stayed flat at $3,000. Notably, one bedroom rent in this city was up 11.1% since this time last year.
5. San Jose, CA rounded off our top 5 markets with one bedroom rent taking a 0.4% dip to $2,450 and two bedrooms increasing 0.3% to $2,950.
Notable Changes This Month
Upward
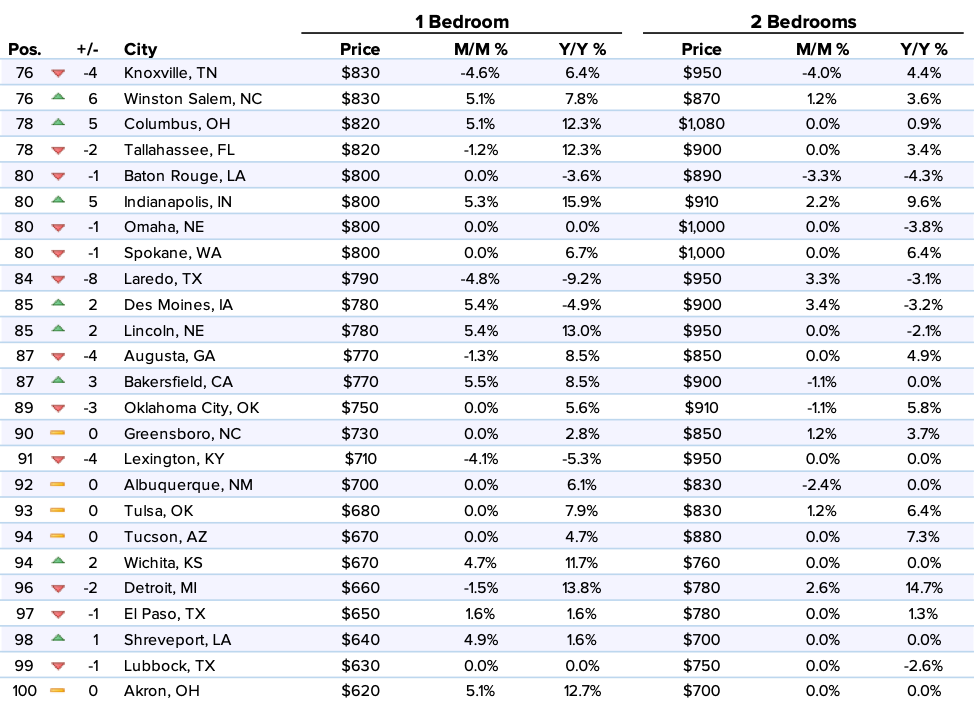
–Bakersfield, CA one bedroom rent had the largest monthly growth rate in the nation, up 5.5% to settle at $770, which moved the city up 3 spots to rank as the 87th most expensive.
–Lincoln, NE shot up 2 positions to rank as 85th with one bedroom rent jumping 5.4% to $780.
–Des Moines, IA one bedroom rent climbed 5.4%, settling at $780, and up 2 spots to become the 85th most expensive market. Two bedroom rent had more modest growth, increasing 3.4% to $900.
–Indianapolis, IN was catapulted up 5 rankings to 80th with one bedroom rent growing 5.3% to $800. Two bedrooms, on the other hand, saw rent increase 2.2% to $910.
–Winston Salem, NC saw one bedroom rent move up 6 positions to become the 76th priciest with a 5.1% growth rate to $830. Two bedrooms increased 1.2% to $870.
Downward
–Laredo, TX one bedroom rent experienced an 8 ranking dip to 84th with one bedroom rent falling 4.8%, which was the largest monthly decline in the nation, to $790.
–Knoxville, TN moved down 4 spots to 76th with one bedroom rent decreasing 4.6% to $830 and two bedrooms dropping 4% to $950.
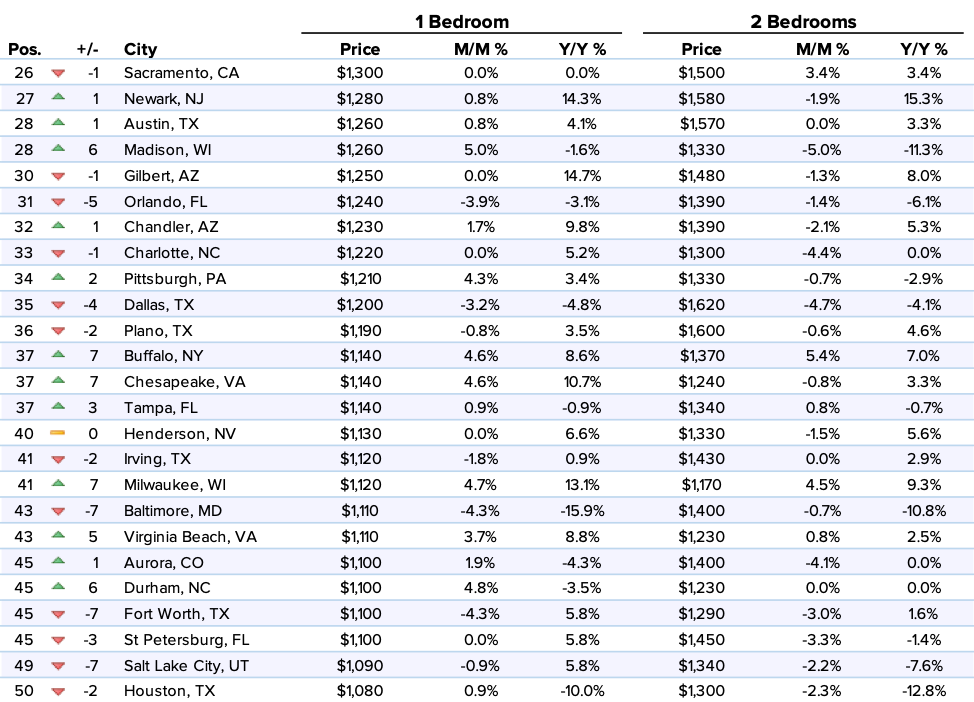
–Providence, RI fell 2 positions to become the 18th most expensive market with one bedroom rent declining 4.5% to $1,480.
–Baltimore, MD took a 7 ranking plunge to 43rd with one bedroom rent dropping 4.3% to $1,110. Two bedrooms were down a slight 0.7% to $1,400.
–Fort Worth, TX also fell 7 spots, settling at 45th, with one bedroom rent decreasing 4.3% to $1,100 and two bedrooms declining 3% to $1,290.
Full Data
| 1 Bedroom | 2 Bedrooms | ||||||
|---|---|---|---|---|---|---|---|
| Pos. | City | Price | M/M % | Y/Y % | Price | M/M % | Y/Y % |
| 1 | San Francisco, CA | $3,530 | -0.60% | -2.50% | $4,670 | -1.70% | -1.10% |
| 2 | New York, NY | $3,000 | 1.00% | 5.30% | $3,500 | 3.90% | 8.00% |
| 3 | Boston, MA | $2,530 | 0.80% | 5.40% | $2,930 | 1.00% | 8.50% |
| 4 | Oakland, CA | $2,500 | 0.80% | 11.10% | $3,000 | 0.00% | 10.30% |
| 5 | San Jose, CA | $2,450 | -0.40% | -2.40% | $2,950 | 0.30% | -1.30% |
| 6 | Los Angeles, CA | $2,300 | 1.30% | -5.30% | $3,260 | 3.20% | 1.20% |
| 6 | Washington, DC | $2,300 | 0.00% | 6.00% | $2,930 | 5.00% | 8.10% |
| 8 | Seattle, WA | $1,880 | -0.50% | 0.50% | $2,300 | -3.80% | -8.40% |
| 9 | San Diego, CA | $1,830 | 1.70% | -3.20% | $2,380 | -0.80% | -5.60% |
| 10 | Miami, FL | $1,710 | -0.60% | -5.00% | $2,220 | -2.60% | -7.50% |
| 11 | Anaheim, CA | $1,660 | -3.50% | -1.80% | $2,060 | -1.90% | -3.70% |
| 12 | Santa Ana, CA | $1,620 | 0.00% | -14.30% | $2,040 | -4.20% | -8.10% |
| 13 | Honolulu, HI | $1,610 | -2.40% | -5.30% | $2,170 | 2.80% | -1.40% |
| 14 | Denver, CO | $1,600 | 1.30% | 6.00% | $1,990 | -0.50% | 2.60% |
| 14 | Fort Lauderdale, FL | $1,600 | 0.00% | 6.70% | $2,200 | 3.80% | 10.00% |
| 16 | Long Beach, CA | $1,550 | 0.60% | 0.00% | $2,000 | 0.00% | 1.50% |
| 17 | Philadelphia, PA | $1,500 | 0.00% | -2.00% | $1,680 | -1.20% | 0.00% |
| 18 | Providence, RI | $1,480 | -4.50% | 0.00% | $1,700 | 3.00% | 3.70% |
| 19 | Portland, OR | $1,470 | 2.80% | 8.90% | $1,750 | -1.10% | 6.70% |
| 20 | Chicago, IL | $1,450 | 1.40% | -3.30% | $1,780 | 1.70% | -3.80% |
| 21 | Atlanta, GA | $1,430 | 1.40% | -3.40% | $1,810 | 0.00% | 0.00% |
| 22 | Scottsdale, AZ | $1,410 | 0.70% | 7.60% | $1,980 | 0.50% | 1.00% |
| 23 | New Orleans, LA | $1,400 | 2.90% | 6.90% | $1,550 | -4.90% | 6.90% |
| 24 | Nashville, TN | $1,350 | 4.70% | 1.50% | $1,400 | -2.80% | 0.00% |
| 25 | Minneapolis, MN | $1,310 | 0.00% | -6.40% | $1,790 | -0.60% | -8.20% |
| 26 | Sacramento, CA | $1,300 | 0.00% | 0.00% | $1,500 | 3.40% | 3.40% |
| 27 | Newark, NJ | $1,280 | 0.80% | 14.30% | $1,580 | -1.90% | 15.30% |
| 28 | Austin, TX | $1,260 | 0.80% | 4.10% | $1,570 | 0.00% | 3.30% |
| 28 | Madison, WI | $1,260 | 5.00% | -1.60% | $1,330 | -5.00% | -11.30% |
| 30 | Gilbert, AZ | $1,250 | 0.00% | 14.70% | $1,480 | -1.30% | 8.00% |
| 31 | Orlando, FL | $1,240 | -3.90% | -3.10% | $1,390 | -1.40% | -6.10% |
| 32 | Chandler, AZ | $1,230 | 1.70% | 9.80% | $1,390 | -2.10% | 5.30% |
| 33 | Charlotte, NC | $1,220 | 0.00% | 5.20% | $1,300 | -4.40% | 0.00% |
| 34 | Pittsburgh, PA | $1,210 | 4.30% | 3.40% | $1,330 | -0.70% | -2.90% |
| 35 | Dallas, TX | $1,200 | -3.20% | -4.80% | $1,620 | -4.70% | -4.10% |
| 36 | Plano, TX | $1,190 | -0.80% | 3.50% | $1,600 | -0.60% | 4.60% |
| 37 | Buffalo, NY | $1,140 | 4.60% | 8.60% | $1,370 | 5.40% | 7.00% |
| 37 | Chesapeake, VA | $1,140 | 4.60% | 10.70% | $1,240 | -0.80% | 3.30% |
| 37 | Tampa, FL | $1,140 | 0.90% | -0.90% | $1,340 | 0.80% | -0.70% |
| 40 | Henderson, NV | $1,130 | 0.00% | 6.60% | $1,330 | -1.50% | 5.60% |
| 41 | Irving, TX | $1,120 | -1.80% | 0.90% | $1,430 | 0.00% | 2.90% |
| 41 | Milwaukee, WI | $1,120 | 4.70% | 13.10% | $1,170 | 4.50% | 9.30% |
| 43 | Baltimore, MD | $1,110 | -4.30% | -15.90% | $1,400 | -0.70% | -10.80% |
| 43 | Virginia Beach, VA | $1,110 | 3.70% | 8.80% | $1,230 | 0.80% | 2.50% |
| 45 | Aurora, CO | $1,100 | 1.90% | -4.30% | $1,400 | -4.10% | 0.00% |
| 45 | Durham, NC | $1,100 | 4.80% | -3.50% | $1,230 | 0.00% | 0.00% |
| 45 | Fort Worth, TX | $1,100 | -4.30% | 5.80% | $1,290 | -3.00% | 1.60% |
| 45 | St Petersburg, FL | $1,100 | 0.00% | 5.80% | $1,450 | -3.30% | -1.40% |
| 49 | Salt Lake City, UT | $1,090 | -0.90% | 5.80% | $1,340 | -2.20% | -7.60% |
| 50 | Houston, TX | $1,080 | 0.90% | -10.00% | $1,300 | -2.30% | -12.80% |
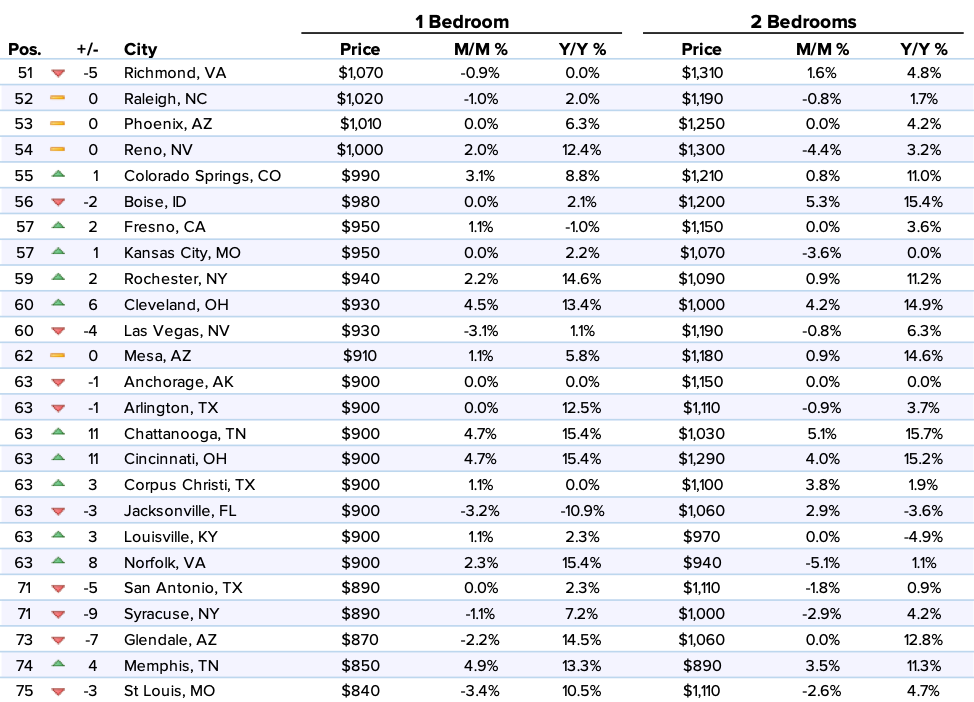
| 51 | Richmond, VA | $1,070 | -0.90% | 0.00% | $1,310 | 1.60% | 4.80% |
| 52 | Raleigh, NC | $1,020 | -1.00% | 2.00% | $1,190 | -0.80% | 1.70% |
| 53 | Phoenix, AZ | $1,010 | 0.00% | 6.30% | $1,250 | 0.00% | 4.20% |
| 54 | Reno, NV | $1,000 | 2.00% | 12.40% | $1,300 | -4.40% | 3.20% |
| 55 | Colorado Springs, CO | $990 | 3.10% | 8.80% | $1,210 | 0.80% | 11.00% |
| 56 | Boise, ID | $980 | 0.00% | 2.10% | $1,200 | 5.30% | 15.40% |
| 57 | Fresno, CA | $950 | 1.10% | -1.00% | $1,150 | 0.00% | 3.60% |
| 57 | Kansas City, MO | $950 | 0.00% | 2.20% | $1,070 | -3.60% | 0.00% |
| 59 | Rochester, NY | $940 | 2.20% | 14.60% | $1,090 | 0.90% | 11.20% |
| 60 | Cleveland, OH | $930 | 4.50% | 13.40% | $1,000 | 4.20% | 14.90% |
| 60 | Las Vegas, NV | $930 | -3.10% | 1.10% | $1,190 | -0.80% | 6.30% |
| 62 | Mesa, AZ | $910 | 1.10% | 5.80% | $1,180 | 0.90% | 14.60% |
| 63 | Anchorage, AK | $900 | 0.00% | 0.00% | $1,150 | 0.00% | 0.00% |
| 63 | Arlington, TX | $900 | 0.00% | 12.50% | $1,110 | -0.90% | 3.70% |
| 63 | Chattanooga, TN | $900 | 4.70% | 15.40% | $1,030 | 5.10% | 15.70% |
| 63 | Cincinnati, OH | $900 | 4.70% | 15.40% | $1,290 | 4.00% | 15.20% |
| 63 | Corpus Christi, TX | $900 | 1.10% | 0.00% | $1,100 | 3.80% | 1.90% |
| 63 | Jacksonville, FL | $900 | -3.20% | -10.90% | $1,060 | 2.90% | -3.60% |
| 63 | Louisville, KY | $900 | 1.10% | 2.30% | $970 | 0.00% | -4.90% |
| 63 | Norfolk, VA | $900 | 2.30% | 15.40% | $940 | -5.10% | 1.10% |
| 71 | San Antonio, TX | $890 | 0.00% | 2.30% | $1,110 | -1.80% | 0.90% |
| 71 | Syracuse, NY | $890 | -1.10% | 7.20% | $1,000 | -2.90% | 4.20% |
| 73 | Glendale, AZ | $870 | -2.20% | 14.50% | $1,060 | 0.00% | 12.80% |
| 74 | Memphis, TN | $850 | 4.90% | 13.30% | $890 | 3.50% | 11.30% |
| 75 | St Louis, MO | $840 | -3.40% | 10.50% | $1,110 | -2.60% | 4.70% |
| 76 | Knoxville, TN | $830 | -4.60% | 6.40% | $950 | -4.00% | 4.40% |
| 76 | Winston Salem, NC | $830 | 5.10% | 7.80% | $870 | 1.20% | 3.60% |
| 78 | Columbus, OH | $820 | 5.10% | 12.30% | $1,080 | 0.00% | 0.90% |
| 78 | Tallahassee, FL | $820 | -1.20% | 12.30% | $900 | 0.00% | 3.40% |
| 80 | Baton Rouge, LA | $800 | 0.00% | -3.60% | $890 | -3.30% | -4.30% |
| 80 | Indianapolis, IN | $800 | 5.30% | 15.90% | $910 | 2.20% | 9.60% |
| 80 | Omaha, NE | $800 | 0.00% | 0.00% | $1,000 | 0.00% | -3.80% |
| 80 | Spokane, WA | $800 | 0.00% | 6.70% | $1,000 | 0.00% | 6.40% |
| 84 | Laredo, TX | $790 | -4.80% | -9.20% | $950 | 3.30% | -3.10% |
| 85 | Des Moines, IA | $780 | 5.40% | -4.90% | $900 | 3.40% | -3.20% |
| 85 | Lincoln, NE | $780 | 5.40% | 13.00% | $950 | 0.00% | -2.10% |
| 87 | Augusta, GA | $770 | -1.30% | 8.50% | $850 | 0.00% | 4.90% |
| 87 | Bakersfield, CA | $770 | 5.50% | 8.50% | $900 | -1.10% | 0.00% |
| 89 | Oklahoma City, OK | $750 | 0.00% | 5.60% | $910 | -1.10% | 5.80% |
| 90 | Greensboro, NC | $730 | 0.00% | 2.80% | $850 | 1.20% | 3.70% |
| 91 | Lexington, KY | $710 | -4.10% | -5.30% | $950 | 0.00% | 0.00% |
| 92 | Albuquerque, NM | $700 | 0.00% | 6.10% | $830 | -2.40% | 0.00% |
| 93 | Tulsa, OK | $680 | 0.00% | 7.90% | $830 | 1.20% | 6.40% |
| 94 | Tucson, AZ | $670 | 0.00% | 4.70% | $880 | 0.00% | 7.30% |
| 94 | Wichita, KS | $670 | 4.70% | 11.70% | $760 | 0.00% | 0.00% |
| 96 | Detroit, MI | $660 | -1.50% | 13.80% | $780 | 2.60% | 14.70% |
| 97 | El Paso, TX | $650 | 1.60% | 1.60% | $780 | 0.00% | 1.30% |
| 98 | Shreveport, LA | $640 | 4.90% | 1.60% | $700 | 0.00% | 0.00% |
| 99 | Lubbock, TX | $630 | 0.00% | 0.00% | $750 | 0.00% | -2.60% |
| 100 | Akron, OH | $620 | 5.10% | 12.70% | $700 | 0.00% | 0.00% |
About
The Zumper National Rent Report analyzes rental data from over 1 million active listings across the United States. Data is aggregated on a monthly basis to calculate median asking rents for the top 100 metro areas by population, providing a comprehensive view of the current state of the market. The report is based on all data available in the month prior to publication.
If you’re interested in a more in-depth explanation of how and why we calculate our rent data, view our methodology post.
To keep up to date with rent changes across the country, like or follow Zumper on Facebook, Twitter, and Instagram. In the market for a new place? Search apartments for renton Zumper.
Related content