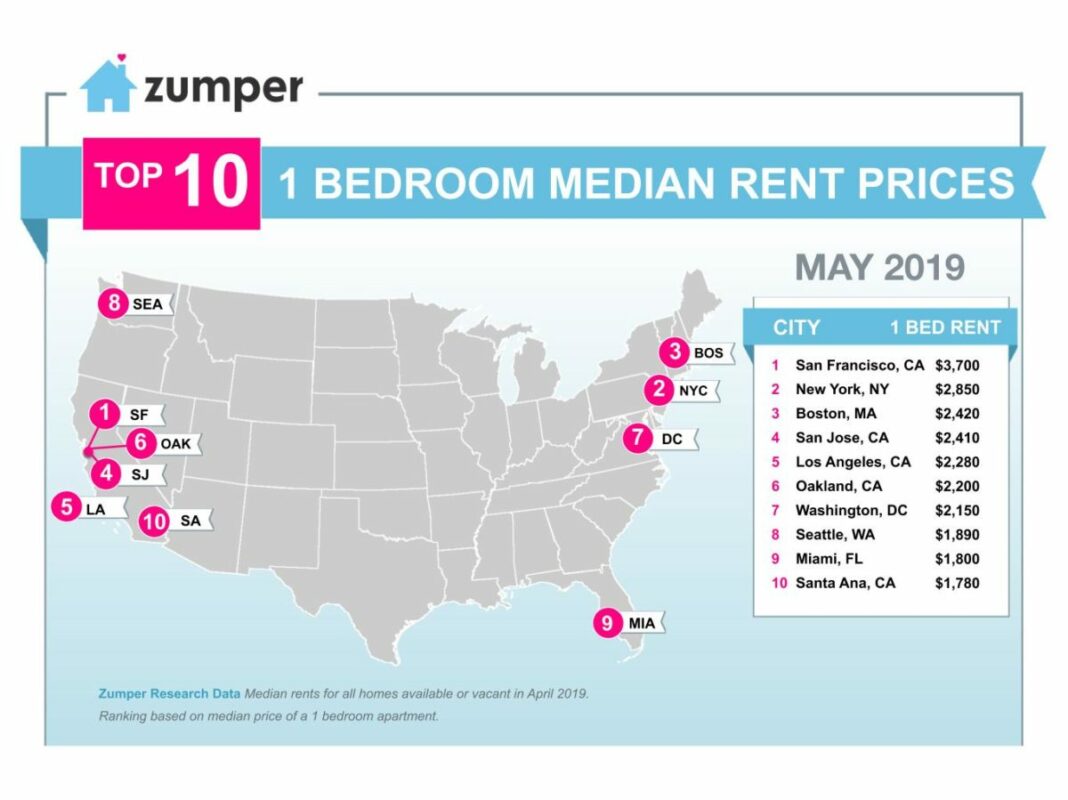
Offering some relief after the last few months of growing prices, San Francisco one bedroom rent stayed flat at $3,700, while two bedrooms actually decreased over 2% on a monthly basis. In the top 10, Boston inched up past San Jose to enter the top 3 markets again as San Diego dropped out.
The rest of the country saw some relief as well since it had the smallest number of cities with double digit year over year rent growth in the past 12 months at least. Only a handful of cities experiencing saw large year over year growth rates, a vast difference from a few months ago. Meanwhile, Bakersfield had the fastest growing one bedroom rent last quarter, up 5.4%, while Louisville took the largest rent dip, down 5.3%.
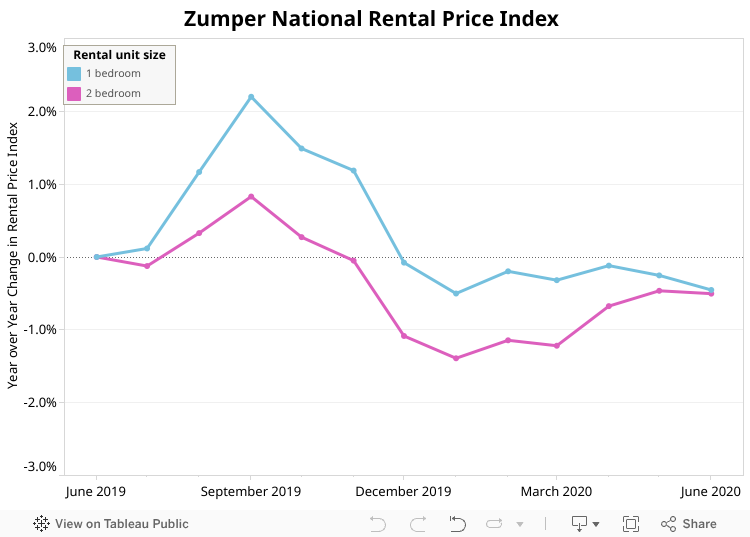
Overall, the national one bedroom rent increased 0.1% to $1,215, while two bedrooms grew 1.2% to $1,463. On a year to date basis, one and two bedroom prices are up 2.5% and 2.9%, respectively.
Top Five Rental Markets
1. San Francisco, CA held steady last month as one bedroom rent stayed stable at $3,700. Two bedrooms, on the other hand, actually fell 2.2% to $4,500.
2. New York, NY also had a flat month with one bedroom rent priced at $2,850, unwavering from the previous month. Two bedrooms saw rent drop 1.9% to $3,140.
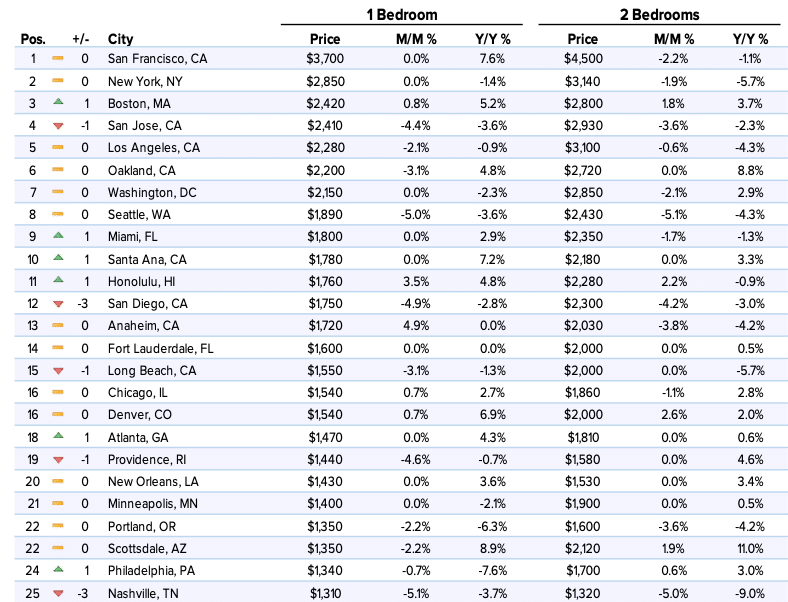
3. Boston, MA moved up one spot and into the top 3 markets with one bedroom rent increasing 0.8% to $2,420. Two bedrooms also saw a slight uptick, growing 1.8% to $2,800.
4. San Jose, CA dropped to 4th with one bedroom rent declining 4.4% to $2,410 and two bedrooms decreasing 3.6% to $2,930.
5. Los Angeles, CA remained as the 5th priciest city, though one bedroom rent dropped 2.1% to $2,280 and two bedrooms decreased a slight 0.6% to $3,100.
Notable Changes This Month
![]() Upward
Upward
–Bakersfield, CA moved up 9 positions to rank as the 77th priciest city. One bedroom rent jumped 5.4%, which was the largest monthly growth rate in the nation, to $790, while two bedrooms grew 4.3% to $980.
–Anaheim, CA, ranking as the 13th most expensive, saw rent climb 4.9% to $1,720 last month.
–Honolulu, HI took a 1 ranking bump up to 11th with one bedroom rent growing 3.5% to $1,760, while two bedrooms increased 2.2% to $2,280.
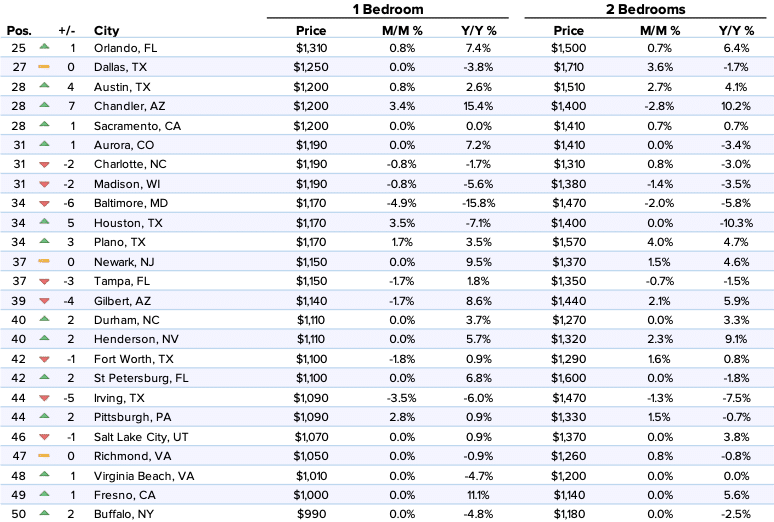
–Houston, TX one bedroom rent climbed 3.5%, settling at $1,170, and up 5 spots to become the 34th priciest.
![]() Downward
Downward
–Louisville, KY took a 5 ranking plunge to 65th with one bedroom rent falling 5.3%, which was the largest monthly rental decline in the nation, to $890. Two bedroom prices decreased 4.8% to $990.
–Seattle, WA saw one bedroom rent fall 5% to $1,890, while two bedrooms had an even larger downturn, down 5.1% to $2,430.
–Jacksonville, FL one bedroom rent dropped 8 spots, to rank as the 58th most expensive, and 5% to settle at $950.
–San Diego, CA moved down 3 positions, and out of the top 10 markets, to rank as the 12th priciest city. One bedroom rent fell 4.9% to $1,750, while two bedrooms decreased 4.2% to $2,300.
–Nashville, TN saw one bedroom rent take a 3 ranking dip, to become 25th, and decrease 5.1%, to settle at $1,310. Two bedroom rent saw a similar decline, down 5% to $1,320.
Full Data
| 1 Bedroom | 2 Bedrooms | ||||||
|---|---|---|---|---|---|---|---|
| Pos. | City | Price | M/M % | Y/Y % | Price | M/M % | Y/Y % |
| 1 | San Francisco, CA | $3,700 | 0.00% | 7.60% | $4,500 | -2.20% | -1.10% |
| 2 | New York, NY | $2,850 | 0.00% | -1.40% | $3,140 | -1.90% | -5.70% |
| 3 | Boston, MA | $2,420 | 0.80% | 5.20% | $2,800 | 1.80% | 3.70% |
| 4 | San Jose, CA | $2,410 | -4.40% | -3.60% | $2,930 | -3.60% | -2.30% |
| 5 | Los Angeles, CA | $2,280 | -2.10% | -0.90% | $3,100 | -0.60% | -4.30% |
| 6 | Oakland, CA | $2,200 | -3.10% | 4.80% | $2,720 | 0.00% | 8.80% |
| 7 | Washington, DC | $2,150 | 0.00% | -2.30% | $2,850 | -2.10% | 2.90% |
| 8 | Seattle, WA | $1,890 | -5.00% | -3.60% | $2,430 | -5.10% | -4.30% |
| 9 | Miami, FL | $1,800 | 0.00% | 2.90% | $2,350 | -1.70% | -1.30% |
| 10 | Santa Ana, CA | $1,780 | 0.00% | 7.20% | $2,180 | 0.00% | 3.30% |
| 11 | Honolulu, HI | $1,760 | 3.50% | 4.80% | $2,280 | 2.20% | -0.90% |
| 12 | San Diego, CA | $1,750 | -4.90% | -2.80% | $2,300 | -4.20% | -3.00% |
| 13 | Anaheim, CA | $1,720 | 4.90% | 0.00% | $2,030 | -3.80% | -4.20% |
| 14 | Fort Lauderdale, FL | $1,600 | 0.00% | 0.00% | $2,000 | 0.00% | 0.50% |
| 15 | Long Beach, CA | $1,550 | -3.10% | -1.30% | $2,000 | 0.00% | -5.70% |
| 16 | Chicago, IL | $1,540 | 0.70% | 2.70% | $1,860 | -1.10% | 2.80% |
| 16 | Denver, CO | $1,540 | 0.70% | 6.90% | $2,000 | 2.60% | 2.00% |
| 18 | Atlanta, GA | $1,470 | 0.00% | 4.30% | $1,810 | 0.00% | 0.60% |
| 19 | Providence, RI | $1,440 | -4.60% | -0.70% | $1,580 | 0.00% | 4.60% |
| 20 | New Orleans, LA | $1,430 | 0.00% | 3.60% | $1,530 | 0.00% | 3.40% |
| 21 | Minneapolis, MN | $1,400 | 0.00% | -2.10% | $1,900 | 0.00% | 0.50% |
| 22 | Portland, OR | $1,350 | -2.20% | -6.30% | $1,600 | -3.60% | -4.20% |
| 22 | Scottsdale, AZ | $1,350 | -2.20% | 8.90% | $2,120 | 1.90% | 11.00% |
| 24 | Philadelphia, PA | $1,340 | -0.70% | -7.60% | $1,700 | 0.60% | 3.00% |
| 25 | Nashville, TN | $1,310 | -5.10% | -3.70% | $1,320 | -5.00% | -9.00% |
| 25 | Orlando, FL | $1,310 | 0.80% | 7.40% | $1,500 | 0.70% | 6.40% |
| 27 | Dallas, TX | $1,250 | 0.00% | -3.80% | $1,710 | 3.60% | -1.70% |
| 28 | Austin, TX | $1,200 | 0.80% | 2.60% | $1,510 | 2.70% | 4.10% |
| 28 | Chandler, AZ | $1,200 | 3.40% | 15.40% | $1,400 | -2.80% | 10.20% |
| 28 | Sacramento, CA | $1,200 | 0.00% | 0.00% | $1,410 | 0.70% | 0.70% |
| 31 | Aurora, CO | $1,190 | 0.00% | 7.20% | $1,410 | 0.00% | -3.40% |
| 31 | Charlotte, NC | $1,190 | -0.80% | -1.70% | $1,310 | 0.80% | -3.00% |
| 31 | Madison, WI | $1,190 | -0.80% | -5.60% | $1,380 | -1.40% | -3.50% |
| 34 | Baltimore, MD | $1,170 | -4.90% | -15.80% | $1,470 | -2.00% | -5.80% |
| 34 | Houston, TX | $1,170 | 3.50% | -7.10% | $1,400 | 0.00% | -10.30% |
| 34 | Plano, TX | $1,170 | 1.70% | 3.50% | $1,570 | 4.00% | 4.70% |
| 37 | Newark, NJ | $1,150 | 0.00% | 9.50% | $1,370 | 1.50% | 4.60% |
| 37 | Tampa, FL | $1,150 | -1.70% | 1.80% | $1,350 | -0.70% | -1.50% |
| 39 | Gilbert, AZ | $1,140 | -1.70% | 8.60% | $1,440 | 2.10% | 5.90% |
| 40 | Durham, NC | $1,110 | 0.00% | 3.70% | $1,270 | 0.00% | 3.30% |
| 40 | Henderson, NV | $1,110 | 0.00% | 5.70% | $1,320 | 2.30% | 9.10% |
| 42 | Fort Worth, TX | $1,100 | -1.80% | 0.90% | $1,290 | 1.60% | 0.80% |
| 42 | St Petersburg, FL | $1,100 | 0.00% | 6.80% | $1,600 | 0.00% | -1.80% |
| 44 | Irving, TX | $1,090 | -3.50% | -6.00% | $1,470 | -1.30% | -7.50% |
| 44 | Pittsburgh, PA | $1,090 | 2.80% | 0.90% | $1,330 | 1.50% | -0.70% |
| 46 | Salt Lake City, UT | $1,070 | 0.00% | 0.90% | $1,370 | 0.00% | 3.80% |
| 47 | Richmond, VA | $1,050 | 0.00% | -0.90% | $1,260 | 0.80% | -0.80% |
| 48 | Virginia Beach, VA | $1,010 | 0.00% | -4.70% | $1,200 | 0.00% | 0.00% |
| 49 | Fresno, CA | $1,000 | 0.00% | 11.10% | $1,140 | 0.00% | 5.60% |
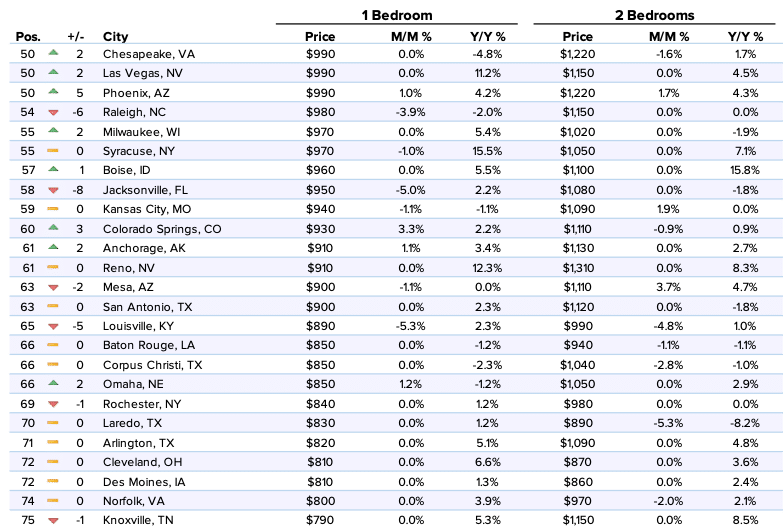
| 50 | Buffalo, NY | $990 | 0.00% | -4.80% | $1,180 | 0.00% | -2.50% |
| 50 | Chesapeake, VA | $990 | 0.00% | -4.80% | $1,220 | -1.60% | 1.70% |
| 50 | Las Vegas, NV | $990 | 0.00% | 11.20% | $1,150 | 0.00% | 4.50% |
| 50 | Phoenix, AZ | $990 | 1.00% | 4.20% | $1,220 | 1.70% | 4.30% |
| 54 | Raleigh, NC | $980 | -3.90% | -2.00% | $1,150 | 0.00% | 0.00% |
| 55 | Milwaukee, WI | $970 | 0.00% | 5.40% | $1,020 | 0.00% | -1.90% |
| 55 | Syracuse, NY | $970 | -1.00% | 15.50% | $1,050 | 0.00% | 7.10% |
| 57 | Boise, ID | $960 | 0.00% | 5.50% | $1,100 | 0.00% | 15.80% |
| 58 | Jacksonville, FL | $950 | -5.00% | 2.20% | $1,080 | 0.00% | -1.80% |
| 59 | Kansas City, MO | $940 | -1.10% | -1.10% | $1,090 | 1.90% | 0.00% |
| 60 | Colorado Springs, CO | $930 | 3.30% | 2.20% | $1,110 | -0.90% | 0.90% |
| 61 | Anchorage, AK | $910 | 1.10% | 3.40% | $1,130 | 0.00% | 2.70% |
| 61 | Reno, NV | $910 | 0.00% | 12.30% | $1,310 | 0.00% | 8.30% |
| 63 | Mesa, AZ | $900 | -1.10% | 0.00% | $1,110 | 3.70% | 4.70% |
| 63 | San Antonio, TX | $900 | 0.00% | 2.30% | $1,120 | 0.00% | -1.80% |
| 65 | Louisville, KY | $890 | -5.30% | 2.30% | $990 | -4.80% | 1.00% |
| 66 | Baton Rouge, LA | $850 | 0.00% | -1.20% | $940 | -1.10% | -1.10% |
| 66 | Corpus Christi, TX | $850 | 0.00% | -2.30% | $1,040 | -2.80% | -1.00% |
| 66 | Omaha, NE | $850 | 1.20% | -1.20% | $1,050 | 0.00% | 2.90% |
| 69 | Rochester, NY | $840 | 0.00% | 1.20% | $980 | 0.00% | 0.00% |
| 70 | Laredo, TX | $830 | 0.00% | 1.20% | $890 | -5.30% | -8.20% |
| 71 | Arlington, TX | $820 | 0.00% | 5.10% | $1,090 | 0.00% | 4.80% |
| 72 | Cleveland, OH | $810 | 0.00% | 6.60% | $870 | 0.00% | 3.60% |
| 72 | Des Moines, IA | $810 | 0.00% | 1.30% | $860 | 0.00% | 2.40% |
| 74 | Norfolk, VA | $800 | 0.00% | 3.90% | $970 | -2.00% | 2.10% |
| 75 | Knoxville, TN | $790 | 0.00% | 5.30% | $1,150 | 0.00% | 8.50% |
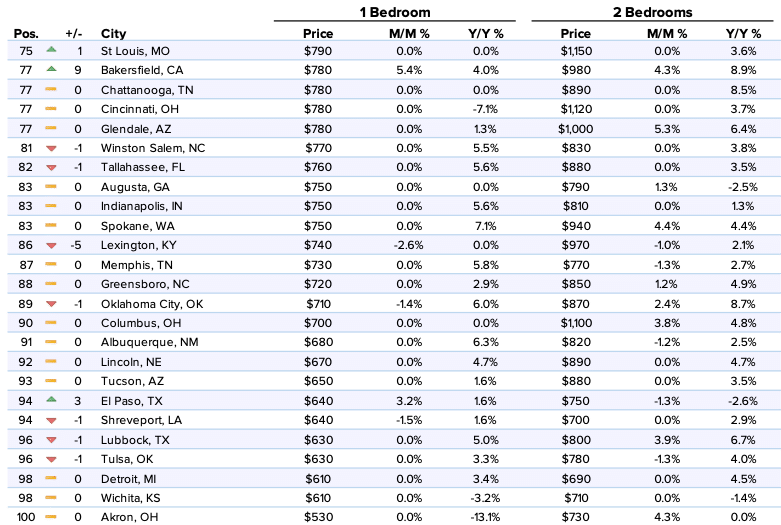
| 75 | St Louis, MO | $790 | 0.00% | 0.00% | $1,150 | 0.00% | 3.60% |
| 77 | Bakersfield, CA | $780 | 5.40% | 4.00% | $980 | 4.30% | 8.90% |
| 77 | Chattanooga, TN | $780 | 0.00% | 0.00% | $890 | 0.00% | 8.50% |
| 77 | Cincinnati, OH | $780 | 0.00% | -7.10% | $1,120 | 0.00% | 3.70% |
| 77 | Glendale, AZ | $780 | 0.00% | 1.30% | $1,000 | 5.30% | 6.40% |
| 81 | Winston Salem, NC | $770 | 0.00% | 5.50% | $830 | 0.00% | 3.80% |
| 82 | Tallahassee, FL | $760 | 0.00% | 5.60% | $880 | 0.00% | 3.50% |
| 83 | Augusta, GA | $750 | 0.00% | 0.00% | $790 | 1.30% | -2.50% |
| 83 | Indianapolis, IN | $750 | 0.00% | 5.60% | $810 | 0.00% | 1.30% |
| 83 | Spokane, WA | $750 | 0.00% | 7.10% | $940 | 4.40% | 4.40% |
| 86 | Lexington, KY | $740 | -2.60% | 0.00% | $970 | -1.00% | 2.10% |
| 87 | Memphis, TN | $730 | 0.00% | 5.80% | $770 | -1.30% | 2.70% |
| 88 | Greensboro, NC | $720 | 0.00% | 2.90% | $850 | 1.20% | 4.90% |
| 89 | Oklahoma City, OK | $710 | -1.40% | 6.00% | $870 | 2.40% | 8.70% |
| 90 | Columbus, OH | $700 | 0.00% | 0.00% | $1,100 | 3.80% | 4.80% |
| 91 | Albuquerque, NM | $680 | 0.00% | 6.30% | $820 | -1.20% | 2.50% |
| 92 | Lincoln, NE | $670 | 0.00% | 4.70% | $890 | 0.00% | 4.70% |
| 93 | Tucson, AZ | $650 | 0.00% | 1.60% | $880 | 0.00% | 3.50% |
| 94 | El Paso, TX | $640 | 3.20% | 1.60% | $750 | -1.30% | -2.60% |
| 94 | Shreveport, LA | $640 | -1.50% | 1.60% | $700 | 0.00% | 2.90% |
| 96 | Lubbock, TX | $630 | 0.00% | 5.00% | $800 | 3.90% | 6.70% |
| 96 | Tulsa, OK | $630 | 0.00% | 3.30% | $780 | -1.30% | 4.00% |
| 98 | Detroit, MI | $610 | 0.00% | 3.40% | $690 | 0.00% | 4.50% |
| 98 | Wichita, KS | $610 | 0.00% | -3.20% | $710 | 0.00% | -1.40% |
| 100 | Akron, OH | $530 | 0.00% | -13.10% | $730 | 4.30% | 0.00% |
About
The Zumper National Rent Report analyses rental data from over 1 million active listings across the United States. Data is aggregated on a monthly basis to calculate median asking rents for the top 100 metro areas by population, providing a comprehensive view of the current state of the market. The report is based on all data available in the month prior to publication.
If you’re interested in a more in-depth explanation of how and why we calculate our rent data, view our methodology post.
To keep up to date with rent changes across the country, like or follow Zumper on Facebook, Twitter, and Instagram. In the market for a new place? Search apartments for rent on Zumper.
Related content