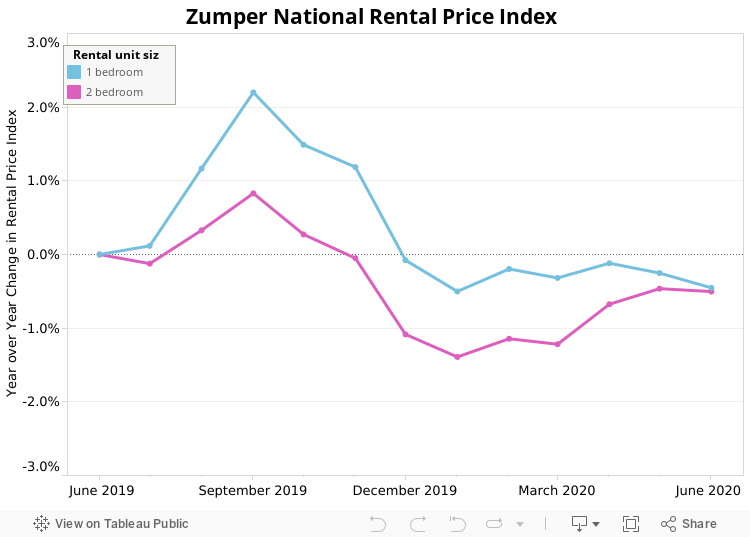
As we get into the summer months, the top 10 markets saw an upward trend for the most part, with the exception of New York City and Washington D.C., which had rents that were down for both bedroom types. While Oakland had the largest growth rate of the most expensive cities, Anaheim took the largest rent dip in the nation. Similar to the last few months, there were lots of cities spread throughout the country with year over year growth rates that are over 10%, an upswing that will most likely continue into the hot moving season.
Overall, the national one bedroom median rent increased 1.1% to $1,198, while two bedrooms, similarly, grew 1% to $1,436. On a year over year basis, both bedroom types are up around 3%.
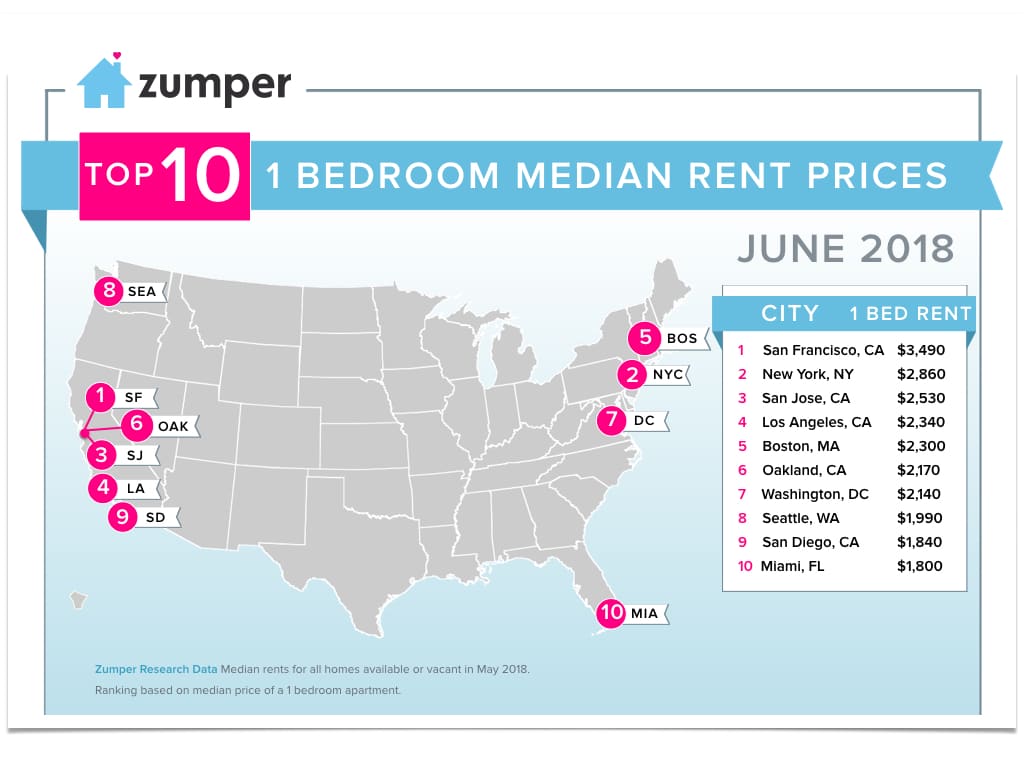
Top Five Rental Markets
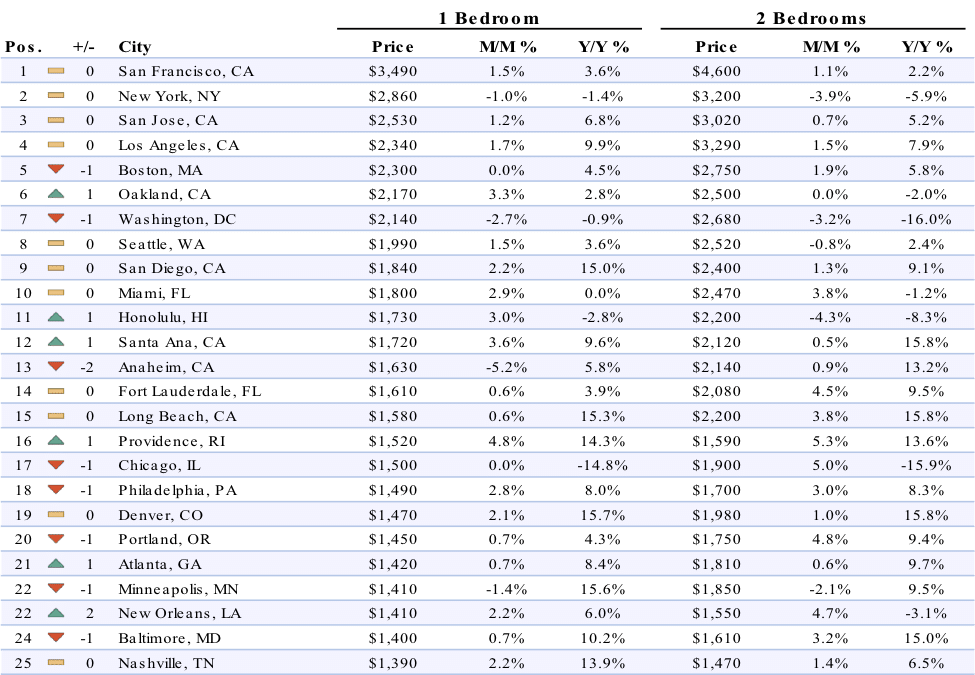
1. San Francisco, CA saw one bedroom rent climb 1.5% to $3,490, remaining the most expensive in the nation. Two bedroom prices saw a similar monthly growth rate, up 1.1% to $4,600.
2. New York, NY stayed 2nd, though both bedroom types took price dips. One bedrooms decreased 1% to $2,860, while two bedrooms dropped 3.9% to $3,200.
3. San Jose, CA was the 3rd most expensive city with one bedroom rent growing 1.2% to $2,530, while two bedrooms increased a slight 0.7% to $3,020.
4. Los Angeles, CA remained 4th with one bedroom rent increasing 1.7% to $2,340, while two bedrooms climbed 1.5% to $3,290. Notably, one bedroom rent is up nearly 10% since this time last year.
5. Boston, MA fell one spot to rank as the 5th priciest rental market. One and two bedrooms settled at $2,300 and $2,750, respectively.
Notable Changes This Month
![]() Upward
Upward
–Providence, RI rose 1 spot to become the 16th most expensive city. One bedroom rent jumped 4.8% to $1,520 while two bedrooms saw an even bigger growth rate, climbing 5.3% to $1,590. On a year over year basis, prices for both bedroom types are up around 14%.
–Newark, NJ moved up 6 spots, to rank as the 38th priciest city, with one bedroom rent growing 4.8% to $1,100. Two bedrooms jumped 5.3% to $1,380.
–Buffalo, NY also climbed up 6 rankings, becoming the 41st most expensive. One bedroom rent rose 4.8% to $1,100, while two bedrooms grew 5% to $1,270.
–St. Petersburg, FL saw one bedroom rent jump 4.9% to $1,080, moving this city up 6 spots to rank as 44th.
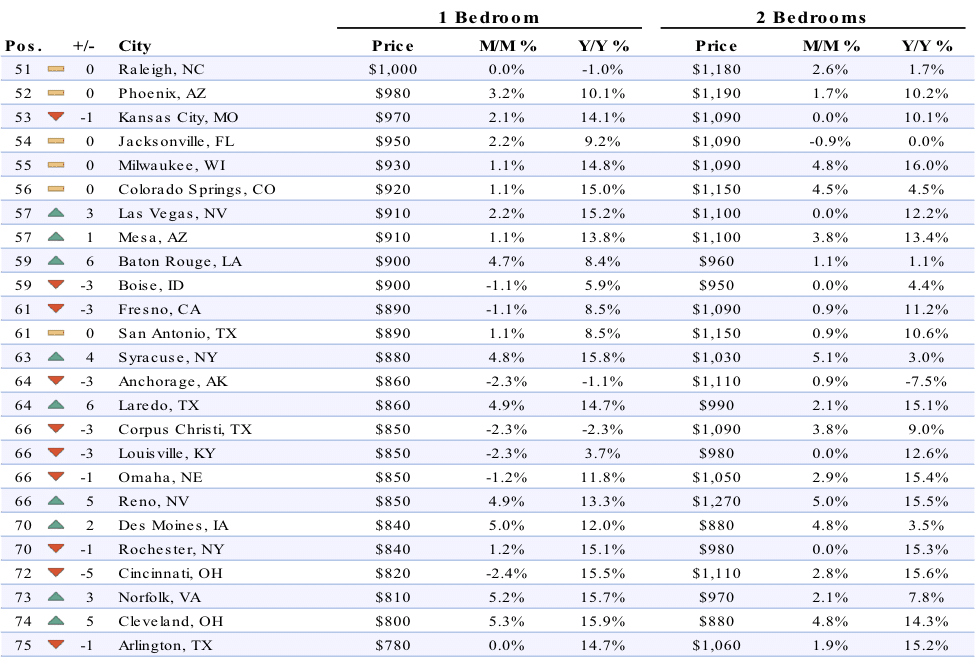
–Baton Rouge, LA bumped up 6 positions as well to settle as the 59th priciest city. One bedroom rent grew 4.7% to $900, while two bedrooms saw more modest growth, increasing 1.1% to $960.
![]() Downward
Downward
–Anaheim, CA dropped 2 spots to become the 13th most expensive city with one bedroom rent falling 5.2%, which was the largest monthly decrease in the nation, to $1,630.
–Richmond, VA saw a 4 ranking dip to 45th with both one and two bedroom prices sinking less than 1% to $1,050 and $1,260, respectively.
–Salt Lake City, UT also moved down 4 spots to become 45th with one bedroom rent falling 0.9% to $1,050.
–Virginia Beach, VA saw one bedroom rent take an 8 ranking plunge to 49th. The price for one bedrooms dropped 1.9% to $1,040, while two bedrooms remained flat at $1,200.
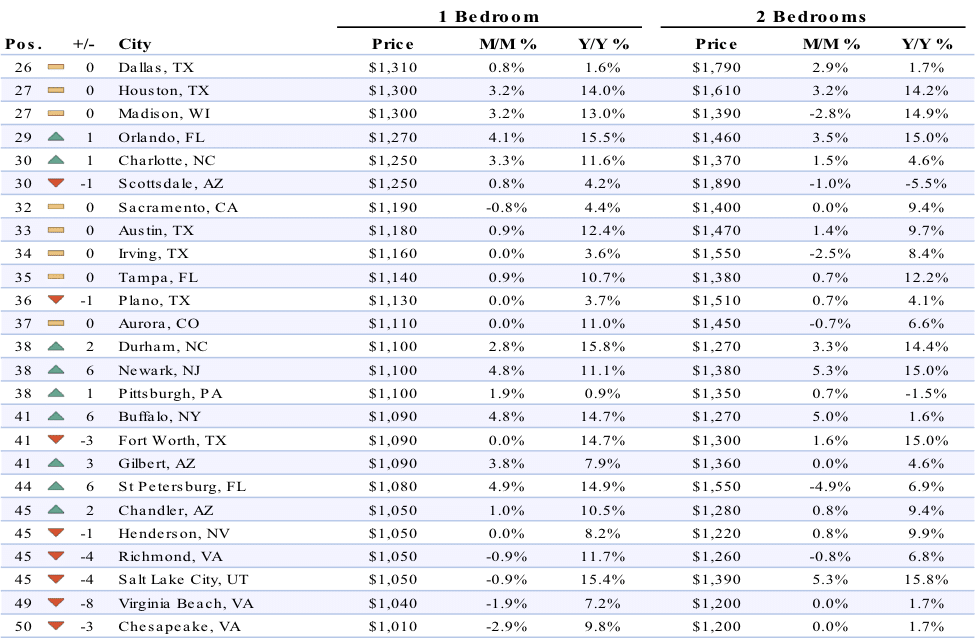
–Corpus Christi, TX one bedroom rent fell 2.3%, settling at $850, and 3 spots to become the 66th priciest in the nation.
Full Data
| 1 Bedroom | 2 Bedrooms | ||||||
|---|---|---|---|---|---|---|---|
| Pos. | City | Price | M/M % | Y/Y % | Price | M/M % | Y/Y % |
| 1 | San Francisco | $3,490 | 1.50% | 3.60% | $4,600 | 1.10% | 2.20% |
| 2 | Mountain View | $3,370 | 5.00% | 15.80% | $4,280 | 4.90% | 15.10% |
| 3 | Redwood City | $3,010 | 4.90% | 5.20% | $3,850 | 4.90% | 0.30% |
| 4 | Emeryville | $2,910 | 5.10% | 13.70% | $3,770 | 1.10% | 4.70% |
| 4 | Sunnyvale | $2,910 | 5.10% | 9.80% | $3,700 | 3.60% | 13.50% |
| 6 | Palo Alto | $2,820 | 0.70% | 1.80% | $3,730 | 0.80% | -11.00% |
| 7 | Santa Clara | $2,810 | 4.50% | 15.60% | $3,600 | 5.00% | 15.80% |
| 8 | San Mateo | $2,680 | 0.40% | 7.60% | $3,630 | 4.00% | 7.10% |
| 9 | Milpitas | $2,610 | 4.80% | 11.50% | $3,090 | 5.10% | 7.30% |
| 10 | Burlingame | $2,530 | -4.90% | 6.80% | $3,430 | -1.70% | 5.90% |
| 10 | San Jose | $2,530 | 1.20% | 6.80% | $3,020 | 0.70% | 5.20% |
| 12 | Berkeley | $2,520 | 0.80% | 1.60% | $3,490 | 5.10% | 2.30% |
| 12 | South San Francisco | $2,520 | 5.00% | 5.00% | $3,350 | -3.50% | -1.80% |
| 14 | Daly City | $2,490 | 4.60% | 10.20% | $3,230 | 3.20% | 14.10% |
| 15 | Union City | $2,440 | 5.20% | 6.10% | $2,490 | 5.10% | -5.00% |
| 16 | Walnut Creek | $2,350 | -3.70% | 9.30% | $2,590 | -3.70% | -1.90% |
| 17 | Fremont | $2,280 | 0.90% | 4.10% | $2,640 | 1.10% | 5.60% |
| 18 | Pleasanton | $2,250 | -0.40% | 0.00% | $2,770 | 0.70% | 7.40% |
| 19 | Oakland | $2,170 | 3.30% | 2.80% | $2,500 | 0.00% | -2.00% |
| 20 | San Ramon | $2,100 | 2.90% | 2.40% | $2,500 | -1.20% | -1.60% |
| 21 | Alameda | $2,080 | -1.00% | 8.30% | $2,700 | -2.50% | 3.10% |
| 22 | Hayward | $1,970 | 2.10% | 4.20% | $2,400 | 0.80% | 1.30% |
| 23 | Petaluma | $1,960 | -4.90% | -8.40% | $2,600 | -1.50% | 9.20% |
| 24 | San Leandro | $1,870 | 0.00% | 5.10% | $2,310 | 1.30% | 0.00% |
| 25 | Livermore | $1,820 | -4.20% | 2.20% | $2,310 | 0.40% | 0.40% |
| 26 | Richmond | $1,790 | -4.80% | -1.60% | $2,170 | -4.80% | 6.40% |
| 27 | Napa | $1,680 | -1.80% | 10.50% | $2,090 | -5.00% | -9.10% |
| 28 | Concord | $1,650 | -0.60% | 1.90% | $2,050 | 1.50% | 9.00% |
| 29 | Santa Rosa | $1,570 | -4.80% | 3.30% | $2,090 | -2.30% | 10.00% |
| 30 | Vallejo | $1,350 | -2.90% | 8.00% | $1,620 | -2.40% | 1.30% |
About
The Zumper National Rent Report analyses rental data from over 1 million active listings across the United States. Data is aggregated on a monthly basis to calculate median asking rents for the top 100 metro areas by population, providing a comprehensive view of the current state of the market. The report is based on all data available in the month prior to publication.
If you’re interested in a more in-depth explanation of how and why we calculate our rent data, view our methodology post.
To keep up to date with rent changes across the country, like or follow Zumper on Facebook, Twitter, and Instagram. In the market for a new place? Search apartments for rent on Zumper.
Related content