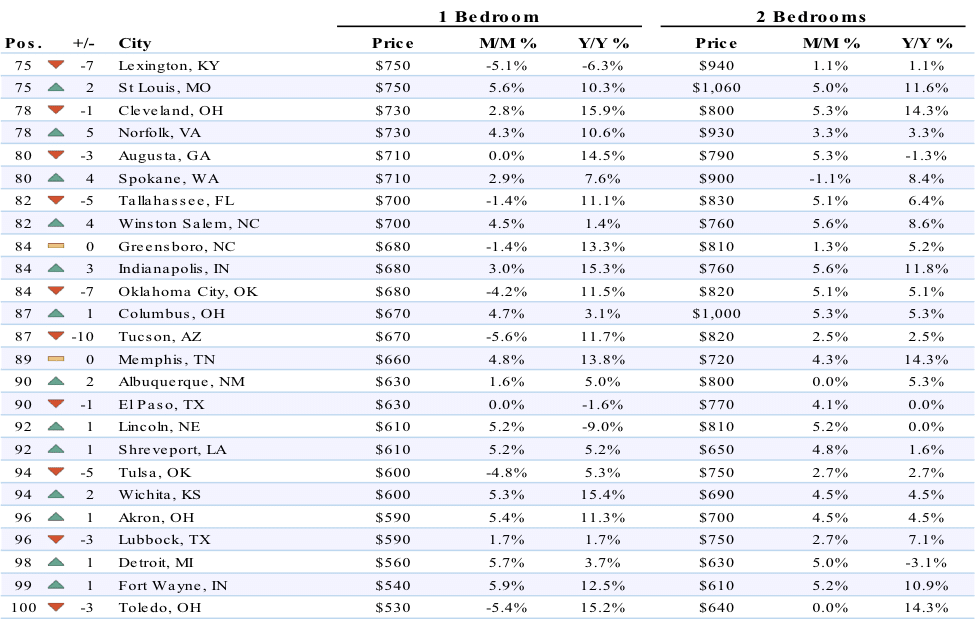
While there were some adjustments in the top 10 markets, the 4 most expensive cities had another fairly stable month. D.C. one bedroom rent saw the largest dip of the top 10 cities, falling 4.1% and out of the top 5 rankings, while Seattle rent was the fastest growing, up 5%. The rest of the nation’s prices experienced an interesting trend where the majority of year over year rent changes that were over 10% were positive. The only 2 cities of the 100 on our report that had large year over year decreases were Chicago, with both bedroom types down over 15%, and Lincoln, with one bedrooms down 9%.
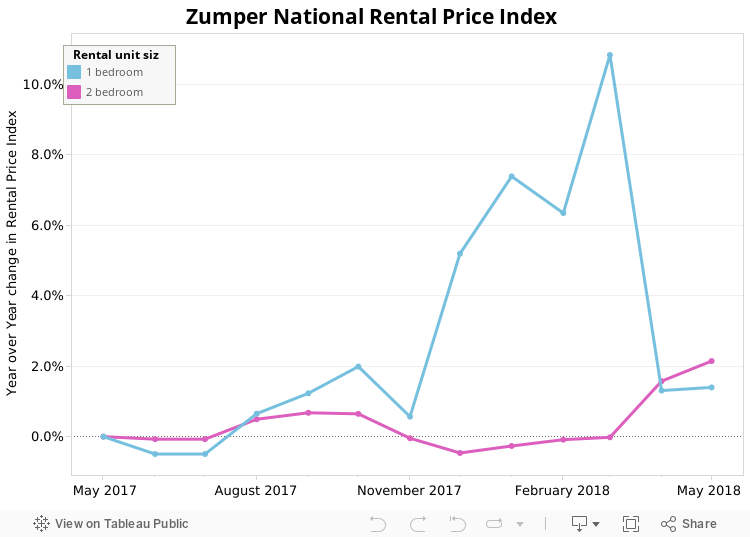
Overall, the national one bedroom rent dropped a staggering 8.9% to $1,184, while two bedrooms grew 1.1% to $1,414. After a historic high for one bedroom rent last month at $1,300, it seems a bubble has popped since rent has fallen back down to below $1,200.
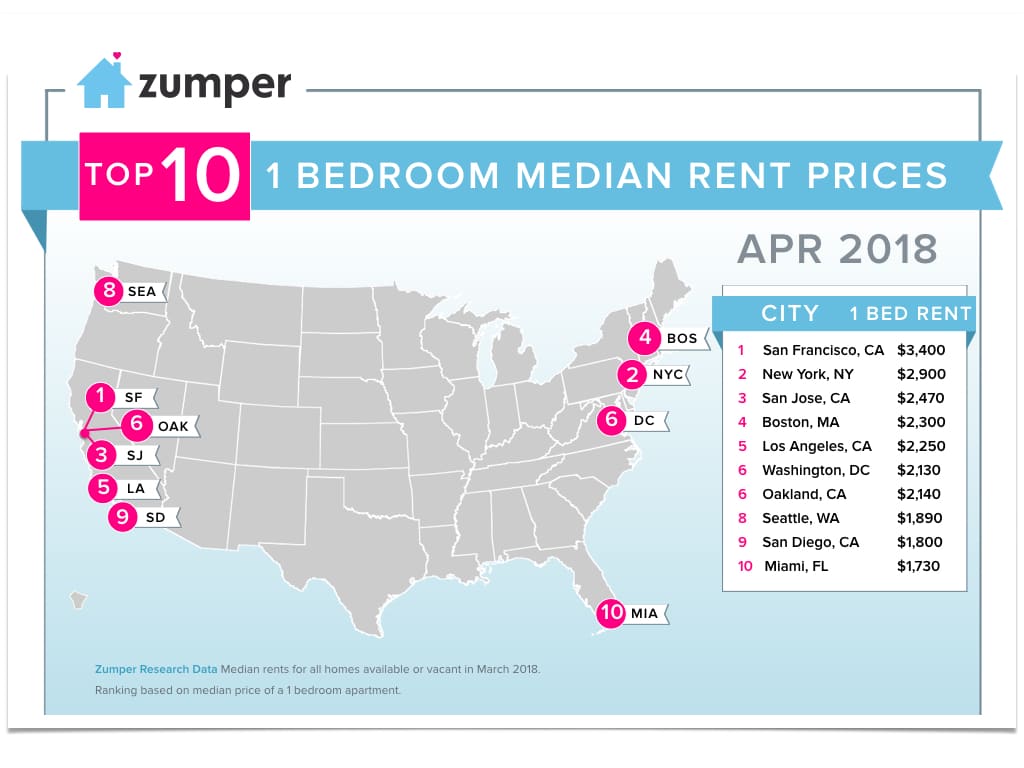
Top Five Rental Markets
1. San Francisco, CA had another fairly flat month with one bedrooms staying stable at $3,400 and two bedrooms increasing 2.5% to $4,510.
2. New York, NY experienced a similar trend to San Francisco’s with one bedrooms fixed at $2,900 and two bedrooms growing 1.7% to $3,500.
3. San Jose, CA held on steady to its ranking as the third most expensive city with one bedroom rent increasing a slight 0.8% to $2,470, while two bedrooms experienced more drastic growth, climbing 3.9% to $2,940. Notably, on a year over year basis, one bedroom rent here is up 9.3%.
4. Boston, MA saw both one and two bedroom prices remain flat last month, staying at $2,300 and $2,700, respectively.
5. Los Angeles, CA moved up 1 spot, outpacing Oakland, to rank as the 5th most expensive city. One bedroom rent grew 2.3% to $2,250, while two bedrooms were stable at $3,200.
Notable Changes This Month
![]() Upward
Upward
–Philadelphia, PA moved up 2 spots to rank as the 15th most expensive city. One bedroom rent jumped 5% to $1,470, while two bedrooms saw an even larger bump, up 5.1% to $1,640.
–Minneapolis, MN one bedroom rent climbed 3 spots and up 5.3%, settling at $1,390, to become the 18th priciest city. Two bedrooms saw a similar upward trend as well, growing 5.1% to $1,850. Notably, on a year over year basis, two bedroom rent here is up 12.8%.
–Nashville, TN one bedroom rent grew 4.8% last month to $1,310, moving up 3 spots to rank as 23rd. Two bedrooms jumped 5.1% to $1,440.
–Madison, WI rose 6 positions to become the 27th priciest city with one bedrooms increasing 5.3% to $1,200 and two bedrooms growing 4.6% to $1,360.
–Milwaukee, WI shot up 7 spots to rank as 56th. One bedroom rent increased 4.8% to $880, while two bedrooms jumped 5.3% to $990.
![]() Downward
Downward
–Scottsdale, AZ fell 7 spots to become the 25th most expensive city with one bedroom rent down 5.1% to $1,290 and two bedrooms dropping 5.2% to $2,010.
–Charlotte, NC saw one bedroom rent decrease 4.2%, settling at $1,150, and dive down 3 spots to rank as 31st.
–Irving, TX dropped 4 positions, now ranking as the 32nd priciest city. One bedroom rent decreased 5% to $1,140, while two bedrooms saw some growth, increasing 4.1% to $1,540.
–Bakersfield, CA one bedroom rent took a 5% and 7 ranking dip to become the 73rd most expensive rental market at $760.
–Glendale, AZ, similar to Scottsdale and Bakersfield, also dropped 7 spots, now ranking as the 75th priciest city. One bedroom rent decreased 5.1% to $750.
Full Data
| 1 Bedroom | 2 Bedrooms | ||||||
|---|---|---|---|---|---|---|---|
| Pos. | City | Price | M/M % | Y/Y % | Price | M/M % | Y/Y % |
| 1 | Centennial | $1,500 | 0.70% | 15.40% | $1,910 | 4.90% | 11.00% |
| 2 | Broomfield | $1,440 | -0.70% | 0.00% | $1,780 | 3.50% | 5.30% |
| 2 | Denver | $1,440 | 2.90% | 15.20% | $1,960 | 2.60% | 15.30% |
| 4 | Lakewood | $1,420 | 5.20% | 13.60% | $1,490 | 4.20% | 8.80% |
| 5 | Castle Rock | $1,390 | 5.30% | 15.80% | $1,560 | 4.70% | 13.90% |
| 6 | Westminster | $1,340 | 1.50% | 13.60% | $1,550 | 4.70% | 8.40% |
| 7 | Littleton | $1,330 | -1.50% | 15.70% | $1,700 | 3.70% | 9.00% |
| 8 | Parker | $1,300 | -1.50% | 0.00% | $1,620 | 3.20% | 3.80% |
| 9 | Arvada | $1,180 | 5.40% | 12.40% | $1,380 | 5.30% | 3.80% |
| 10 | Thornton | $1,170 | -4.10% | 15.80% | $1,470 | 1.40% | 15.70% |
| 11 | Aurora | $1,110 | -0.90% | 12.10% | $1,460 | 3.50% | 7.40% |
| 12 | Northglenn | $1,090 | -5.20% | 5.80% | $1,350 | 0.00% | -0.70% |
About
The Zumper National Rent Report analyses rental data from over 1 million active listings across the United States. Data is aggregated on a monthly basis to calculate median asking rents for the top 100 metro areas by population, providing a comprehensive view of the current state of the market. The report is based on all data available in the month prior to publication.
If you’re interested in a more in-depth explanation of how and why we calculate our rent data, view our methodology post.
To keep up to date with rent changes across the country, like or follow Zumper on Facebook, Twitter, and Instagram. In the market for a new place? Search apartments for rent on Zumper.
Related content