Considering Donald Trump’s controversial stint thus far as President, one may wonder whether his real estate empire has seen any negative effects. While this is not the first time Trump and his brand have been the focus of unfavorable coverage, his election coverage has been the most widespread in terms of reach and intensity. In the decades building his real estate portfolio and personal brand, President Trump has dealt with many situations: public praise and scrutiny; prosperity and bankruptcy. Yet, he has seemed to weather most storms. Considering the magnitude of the presidency, is this time different? Have his rental real estate holdings (which are uniquely tied to public perception) been affected given his political persona?
We examined rental transaction data from seven buildings bearing the Trump name across New York City, his hometown and the most prominent in his portfolio, to answer one question: is it tougher to rent units bearing the Trump name post-election?
Methodology:
To do this, we identified seven buildings across New York City owned and operated by the Trump Organization which also bear the “Trump” name. We then analyzed hundreds of rental listings in these buildings posted on Zumper both before and after the election. We split these into “Pre-Election” and “Post-Election” categories, depending on the date each unit was rented.
To make sure we also compared against overall market trends, we identified seven comparable buildings not owned or operated by The Trump Organization, and created building pairs. These buildings were chosen via criteria that would make them comparable to the Trump buildings for any renter, including proximity, similar interior finish, service/amenities, price, high/low rise, and year built.
7 Trump Buildings: Trump Palace, Trump Parc, Trump Parc East, Trump Park Avenue, Trump Place at 200 Riverside Boulevard, Trump Tower, The Trump World Tower.
7 Non-Trump Buildings: The Oxford, JW Marriott Essex House, 116 Central Park South, 530 Park Avenue, The Rushmore, Olympic Tower, 100 United Nations Plaza.
Analysis of rental transactions across these 14 buildings for equal amounts of time bookending President Trump’s election on November 8th, 2016 yielded a total of 377 unit postings (from December 2015 through October 2017).
To measure the rental desirability of each building, we calculated the average time on market (ToM) for a listing, as well as the average price change over the course of a listing being available. These two measures were again split up into pre and post-election.
The hypothesis we set out to test was that, if a negative Trump effect did exist, units in Trump buildings would show longer time on market and deeper price cuts post-election when compared with control buildings.
Results:
In 5 of 7 building pairs, units in Trump owned buildings performed worse over the post-election period when compared to non-Trump buildings, meaning that there was in fact a negative effect. The only two cases where this did not hold true were the Trump Parc & JW Marriott Essex House pairing (Trump fared better) and Trump Place & The Rushmore pairing (buildings were relatively equal).
Furthermore, in 3 of those pairs, Trump owned buildings experienced a longer leasing time post-election, while the non-Trump buildings saw shorter cycles when compared with the pre-election period. This can be seen in the “ToM Change” column, when one statistic is positive and the other negative.
At a micro level, one interesting observation we noticed was even in the cases where a negative Trump effect did exist, affordable units in these buildings were not affected. Cheaper units in Trump buildings, in the $2,500-$4,000/month range, were rented as quickly post-election as they were pre-election. In the end, New York is still the most competitive housing market in the country, meaning that affordable deals in solid locations still get rented quickly, despite any potential stigma.
Breakdown of Results:
1. Trump Palace / The Oxford (Lenox Hill)
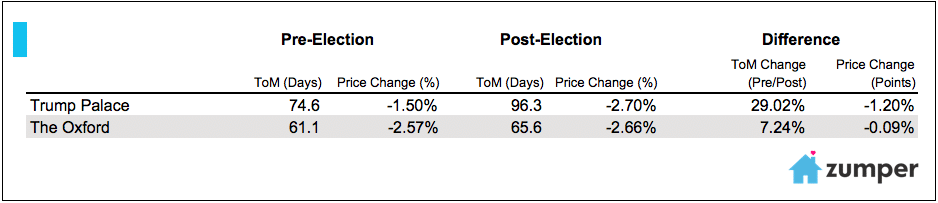
Trump Palace units saw a 29% longer time on market post-election compared to the same period pre-election, while the Oxford only saw 7% longer. The Trump Palace also took deeper price cuts over the second period, 1.2 percentage points more, compared with only 0.09 percentage points more for The Oxford.
Outcome: Trump building performed worse than comparable building
2. Trump Parc East / 116 Central Park South (Central Park South)
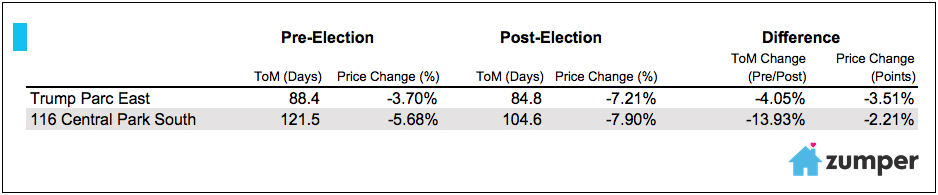
In this pairing, both buildings saw less time on market in the post-election period, however at the cost of deeper price cuts. When comparing the two, the Trump Parc East saw 4% less time on market versus pre-election, while 116 Central Park South saw 14% less time on market. The Trump building also experienced deeper price cuts over the second period, when compared with the non-Trump building.
Outcome: Trump building performed worse than comparable building
3. Trump Parc / JW Marriott Essex House (Central Park South)
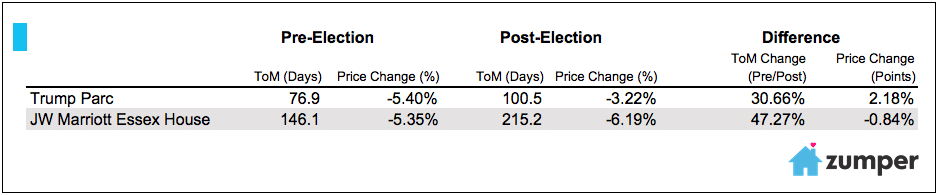
Both the Trump Parc and JW Marriott Essex House saw units stay on the market much longer post-election compared with pre-election. However, listings in the Trump Parc were on the market 30% longer versus the JW Marriott at 47%. Listings in the Trump building also saw smaller price cuts, while the JW Marriott had larger cuts.
Outcome: Trump building performed better than comparable building
4. Trump Park Avenue / 530 Park Avenue (Lenox Hill)
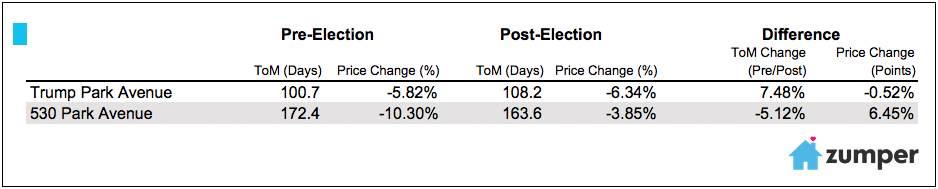
This pairing saw the Trump Park Avenue have a longer time on market post-election with deeper price cuts. On the other side, 530 Park Avenue’s units actually had a shorter time on market, with less price cuts compared with the pre-election period.
Outcome: Trump building performed worse than comparable building
5. Trump Place at 200 Riverside Boulevard / The Rushmore (Upper West Side)
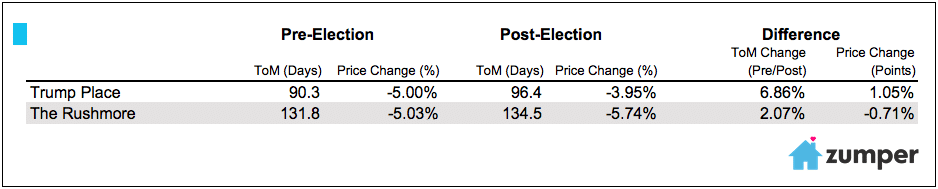 Both Trump Place and The Rushmore experienced longer times on market, with The Rushmore experiencing a slightly more favorable 2% increase versus 7% for the Trump building. However, Trump Place saw less price drops in percentage terms post-election compared to pre-election, while The Rushmore saw greater drops over the two periods.
Outcome: Trump building performed equal to comparable building
6. Trump Tower / Olympic Tower (Midtown East)
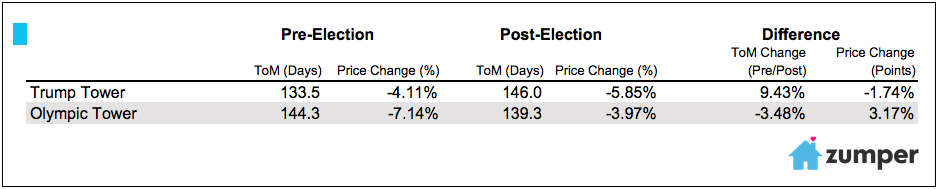
Trump Tower, likely the most famous and notable building in the Trump portfolio, saw rental units in the building have a longer time on market and deeper price cuts after the Trump election. By contrast, units in the Olympic Tower were on the market fewer days with less price cuts after the election date.
Outcome: Trump building performed worse than comparable building
7. The Trump World Tower / 100 United Nations Plaza (Midtown East)
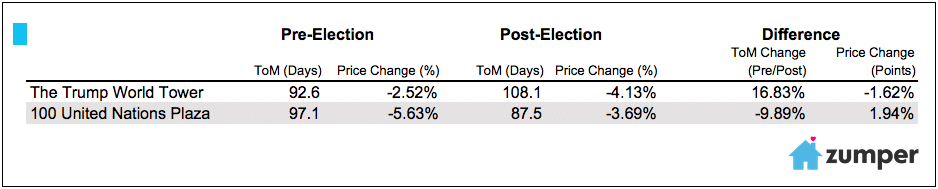
The Trump World Tower had a noticeably tougher time renting units compared with 100 United Nations Plaza. The Trump building saw a 17% longer time on market, while the comparable building had a 10% shorter time. Trump’s building also had larger price cuts after his election.
Outcome: Trump building performed worse than comparable building
Full Dataset:
| 1 Bedroom | 2 Bedrooms | ||||||
|---|---|---|---|---|---|---|---|
| Pos. | City | Price | M/M % | Y/Y % | Price | M/M % | Y/Y % |
| 1 | Houston | $1,260 | 5.00% | 15.60% | $1,560 | 4.00% | 14.70% |
| 2 | Sugar Land | $1,150 | 4.50% | 11.70% | $1,430 | 2.10% | 2.90% |
| 3 | Missouri City | $1,130 | 4.60% | 10.80% | $1,360 | -2.90% | 3.00% |
| 4 | The Woodlands | $1,100 | 3.80% | 8.90% | $1,410 | 0.00% | 4.40% |
| 5 | Pearland | $1,060 | 5.00% | 2.90% | $1,340 | -2.90% | 1.50% |
| 6 | League City | $1,040 | 4.00% | 13.00% | $1,250 | 5.00% | 4.20% |
| 7 | Conroe | $960 | 4.30% | 14.30% | $1,130 | -5.00% | 6.60% |
| 8 | Spring | $920 | 4.50% | 3.40% | $1,130 | 4.60% | 1.80% |
| 9 | Baytown | $750 | -1.30% | 8.70% | $900 | -1.10% | 8.40% |
| 10 | Pasadena | $700 | 0.00% | 7.70% | $870 | -1.10% | 4.80% |
Related content


