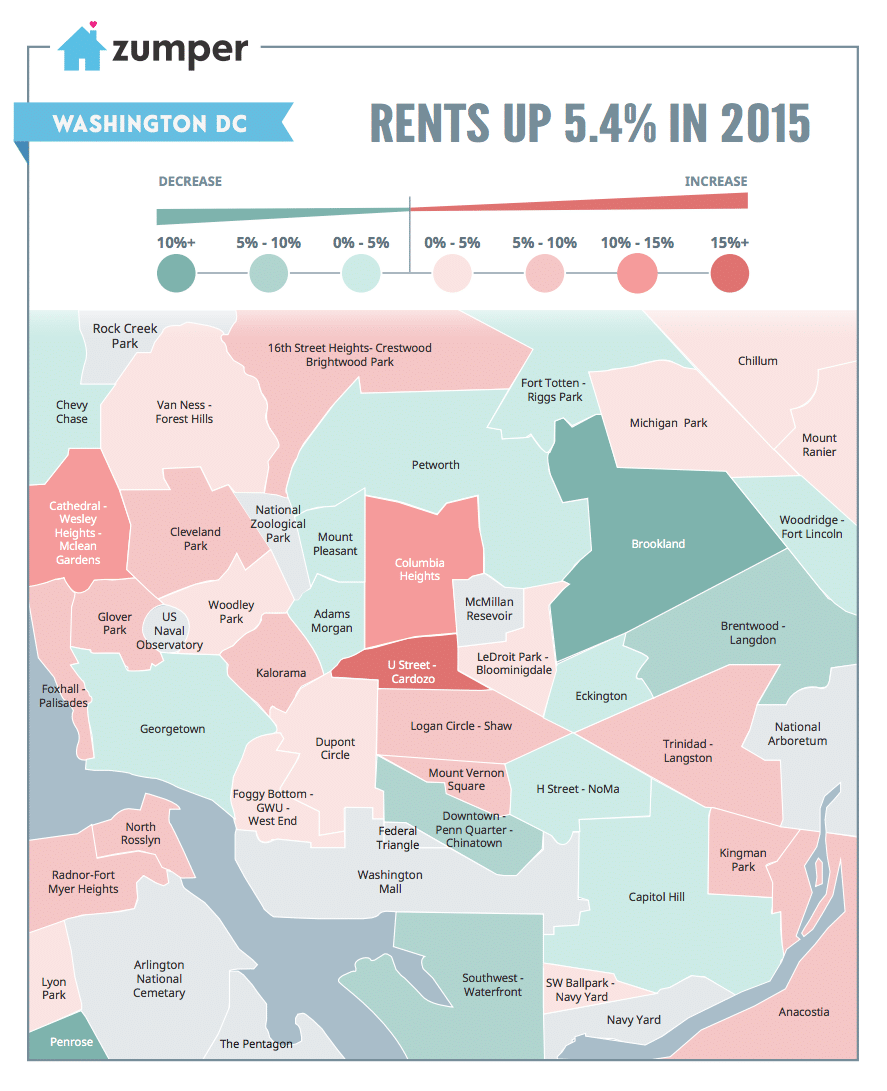
Rent prices across the vast majority of cities in the nation surged in 2015. Strong urban migration, low vacancy rates, and a greater population of renters relative to homeowners contributed to the rise. Washington D.C. was no exception, as asking rent prices increased 5.4% in the year, eight times the rate of inflation.
Despite this overall increase, the distribution of changes varied considerably depending on neighborhood. Our map below depicts the percentage change in prices for one bedroom units in D.C., between December 2014 and December 2015.

Neighborhoods experiencing the largest increases were U Street – Cardozo (+15%), Columbia Heights (+14.35%), and Cathedral – Wesley Heights – Mclean Gardens (+10.2%). Other areas seeing strong rent gains over the year included Logan Circle, Cleveland Park and Kalorama, all up between 5-10%.
On the other side, many areas actually dropped in price. Brookland saw the most pronounced drop (-12%), followed by Downtown/Penn Quarter (-7.2%), and Brentwood – Langdon (-7.1%). Georgetown was an example of a neighborhood that, while still expensive in absolute terms with a one bedroom median of $2,400, saw prices decrease a slight 2% in the year.
If you’re interested to see how these changes compare to the rest of the United States, view our December National Rent Report, which analyzes over 1 million active listings available in the month prior to publication.
Want to keep track of rental trends? Follow us on Facebook, Twitter, or Pinterest. In the market for a new place? Search over 2,200 apartments in DC on Zumper.


