
Over the last year:
- Three out of four Americans living in counties with a median annual income below $65,000 saw rents increase
- Six out of ten Americans living in counties with a median annual income greater than $100,000 saw rents decrease
- Rents in suburban and rural counties outpaced rents in urban counties by about 7% on average
- Expensive cities saw rents decline while more affordable cities saw rents climb
Introduction
As of March 2021, a full year has passed since the coronavirus pandemic hit the United States. An overwhelming amount of evidence has shown that the pandemic and subsequent recession were defined by inequality. Those towards the bottom of the income distribution faced adverse outcomes such as higher rates of infection and unemployment. Meanwhile, those towards the top have remained relatively unaffected.
Housing is another facet in which the pandemic has disproportionately harmed lower income Americans. The country currently faces a looming eviction crisis. An estimated $33 billion was owed in back rent by 6 million Americans as of March of 2021 according to Moody’s Analytics– an average of about $5,300 per person. There is plenty of evidence that this enormous sum of back rent is disproportionately owed by less affluent Americans and racial and ethnic minorities. According to the latest Household Pulse Survey from the Census, 20% of households earning less than $30,000 were behind on rent payments, while only 12% of households earning $30,000 or more were behind. Additionally, 20% of Black and Hispanic households were behind on rent, compared to only 11% of White households.
The Biden administration’s recently passed American Rescue Plan contains $21.6 billion to help cover back rent and utilities. But an approximate $11 billion of owed back rent would persist after this federal assistance, and it will likely continue to accumulate in the coming months. This owed back rent will likely still lead to an eviction cliff in the near future despite the nationwide eviction moratorium recently being extended to the end of June.
This all paints a drastic picture for American renters and housing affordability in 2021. However, the pandemic likely affected housing affordability in another way- through rental prices. With a year’s worth of data on rents, the rest of this article discusses how rental market trends brought on by the pandemic likely had an adverse affect on housing affordability in the US.
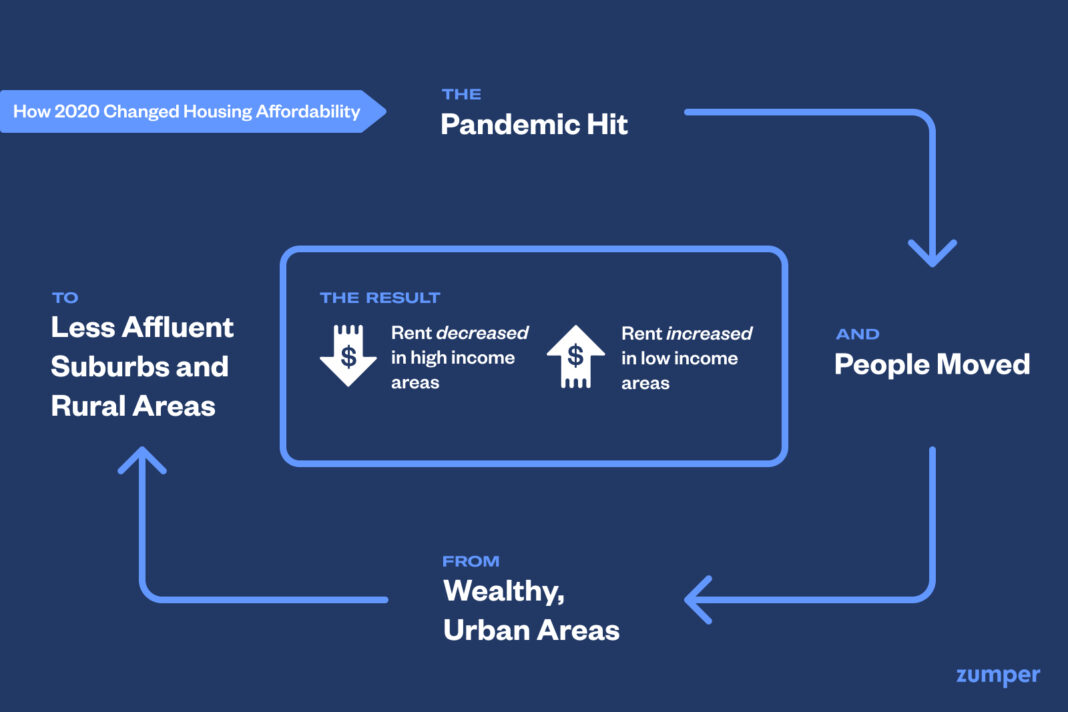
A Brief Recap
Soon after the pandemic hit the US in March 2020, the labor market crashed and the economy entered a recession. Additionally, many employers limited in-office gatherings and expanded work from home policies in an attempt to limit the spread of the virus. As a result, a significant number of people moved out of expensive, urban markets due to either financial hardship or the ability to work remotely. The most popular destinations these urbanites moved to were cheaper, less-urban, neighboring locations. These destinations saw substantial increases to housing costs due to the influx of new demand. Meanwhile, the urban markets that people left saw substantial housing cost decreases.
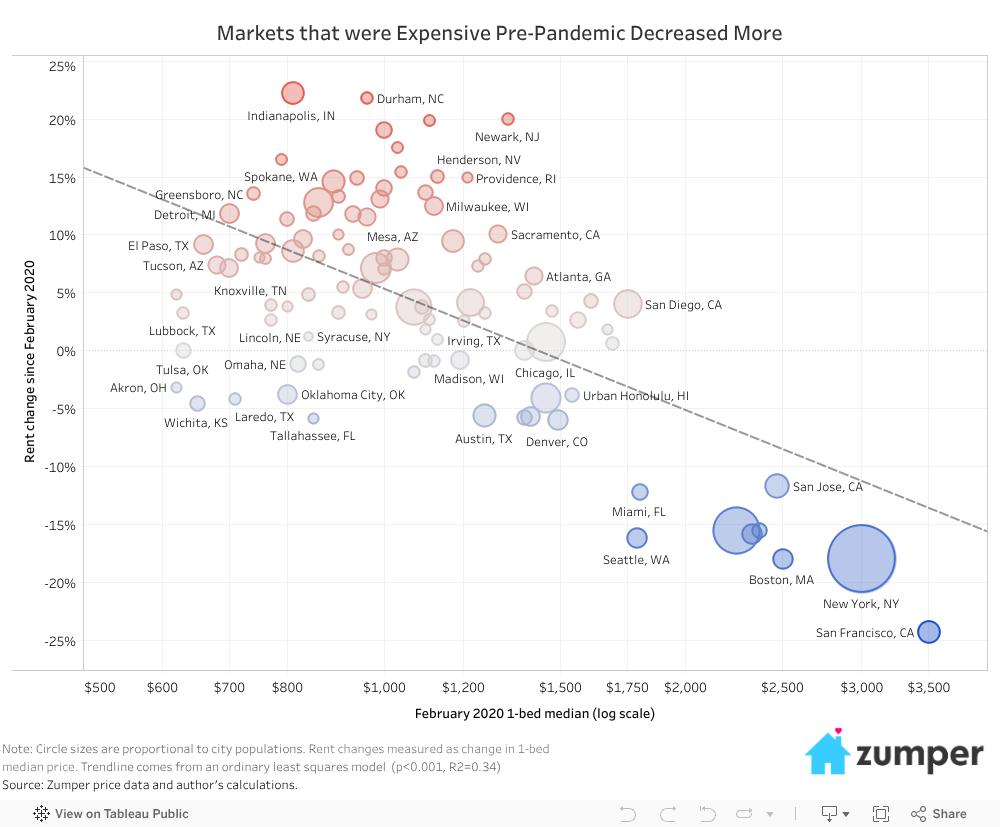
In the rental market, the more expensive a city’s pre-pandemic rent was, the more likely it was to decrease. Inversely, the cheaper a city was pre-pandemic, the more likely rents went up. This relationship can be visualized by comparing median rent prices in each city right before the pandemic (February 2020) to the growth in those median prices since the pandemic. The chart below shows this relationship for the 100 cities tracked in the Zumper National Rent Report.
2020 Rental Market Trends Likely Decreased Housing Affordability
The above chart shows that the most expensive parts of the country saw significant decreases to rental prices, while historically cheaper places saw rents rise. However, rental prices are highly correlated with income so expensive cities where rents dropped the most are also some of the most affluent cities in the country. Conversely, cheaper cities where rents increased have less affluent populations in general. Thus, 2020 gave rise to a divergence between rents and income, which likely led to an aggregate decrease in housing affordability in the US.
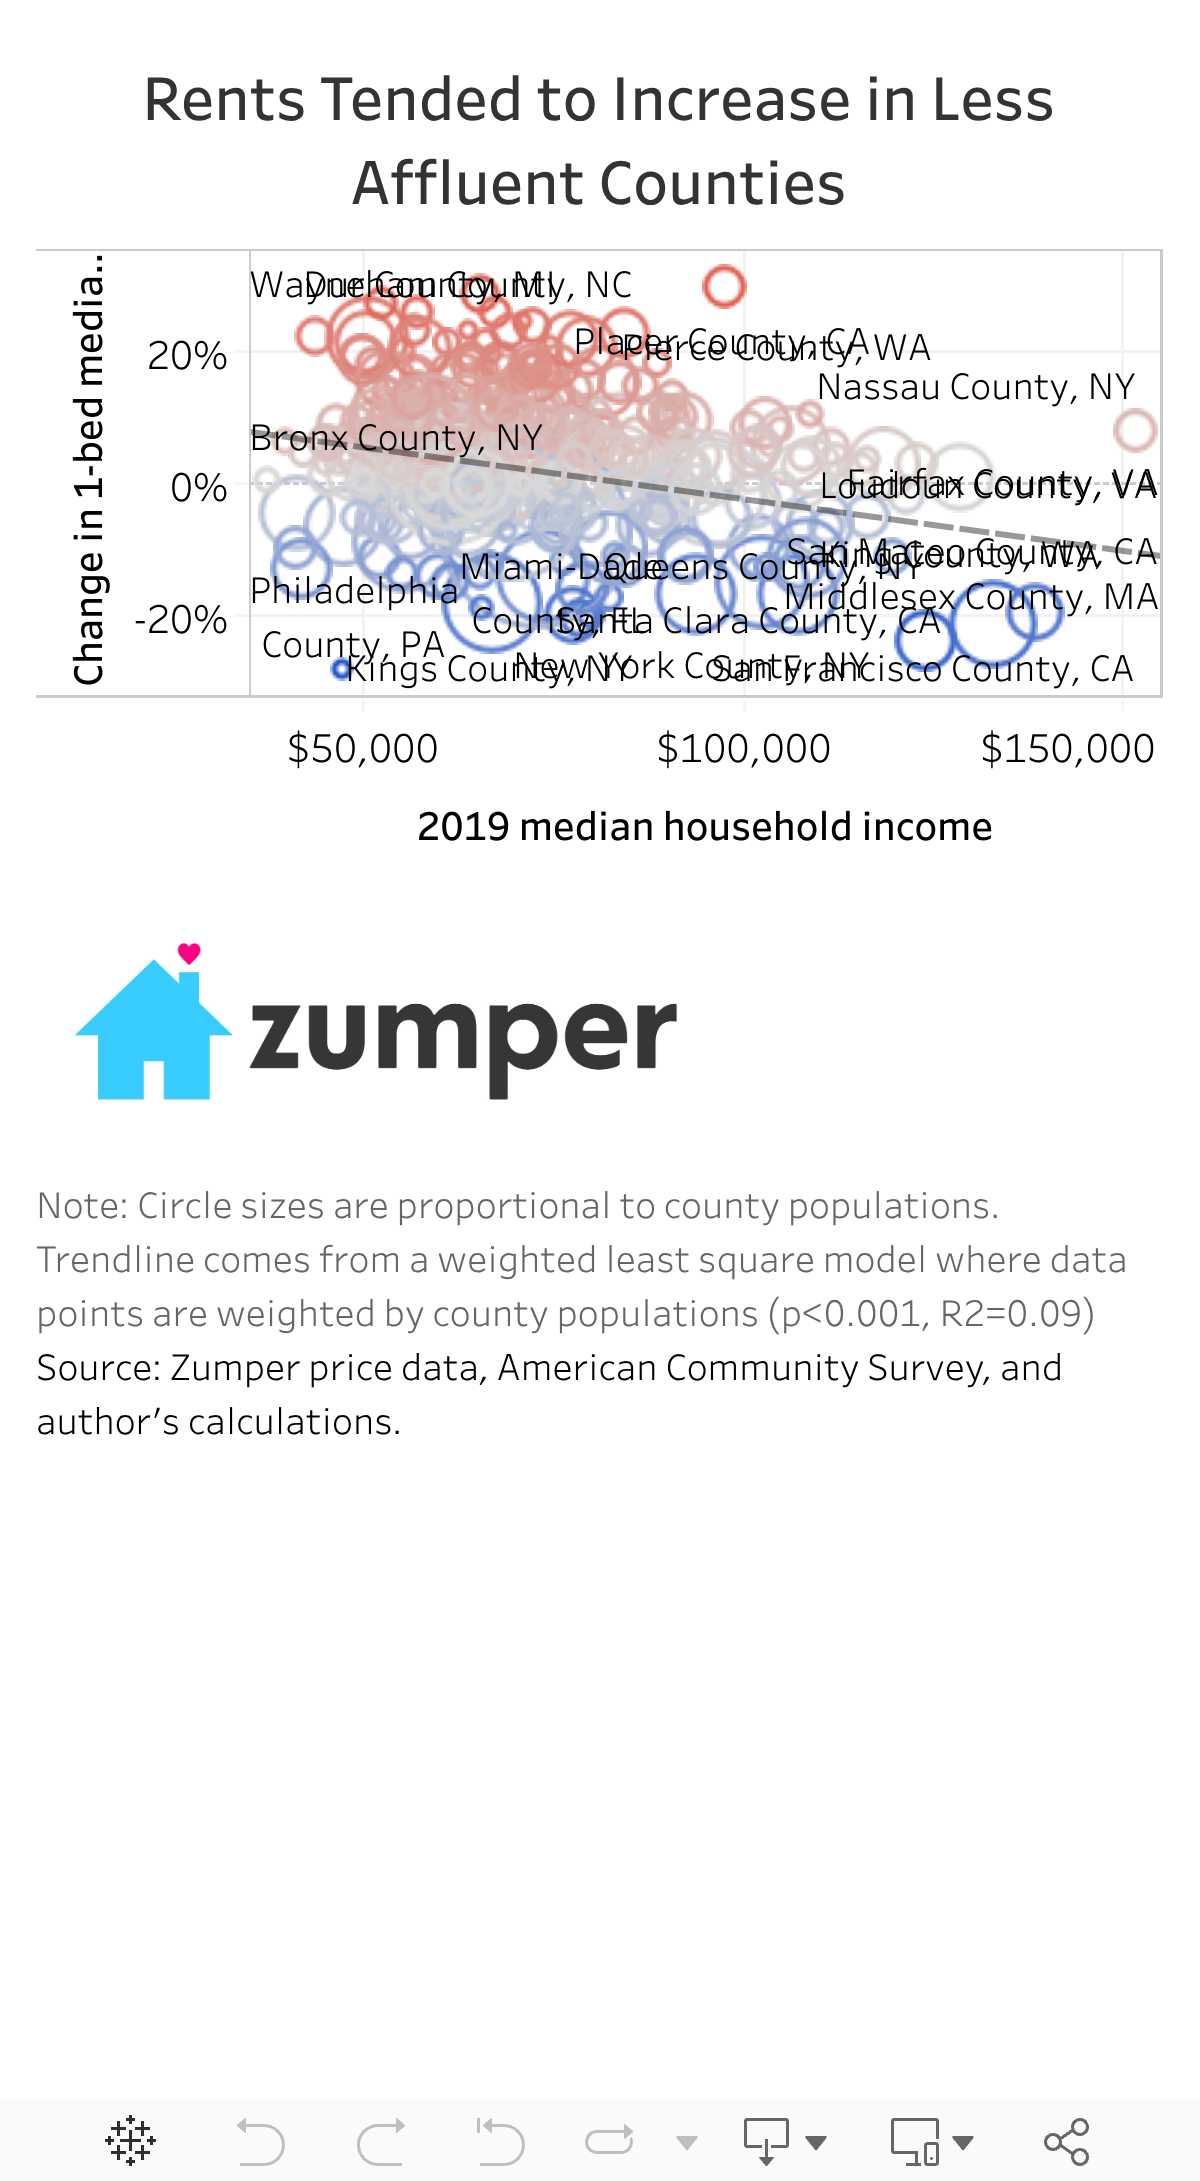
This divergence can be seen by comparing rent changes and incomes across the country. The chart below shows changes in 1-bedroom median rent compared to median household incomes at the county level in 2020. Data for all counties in which Zumper had sufficient coverage (at least 50 listings in February 2021 and February 2020) are included. The result is a sample of 410 counties, which represent about 70% of the US population. Zumper’s listings skew toward urban areas, so many less populous, rural counties are missing in the data. However, a vast majority of Americans are represented since there is ample coverage in populous counties, and a significant amount of non-urban and rural counties represented in the data as well.
The above plot provides some interesting insights into how housing affordability changed in 2020.
First, there was a clear inverse relationship between income and rent growth in 2020- less affluent counties tended to see rents grow while more affluent counties tended to see rents decline. Fitting a trendline to this data weighted by each county’s population results in a slope of -1.6% per $10,000 (p<0.001, r2=0.09). This implies that for every $10,000 increase in a county’s median income, rent changed about 1.6% less, on average. This trend is denoted by the dashed line in the above plot.
Secondly, the extremes of this trend paint a somewhat alarming picture. Consider the differences between Santa Clara County, CA and Wayne County, MI- two regions with populations of a similar size. Santa Clara County- fueled by an exodus of people out of the Bay Area– saw one of the largest rental price decreases in 2020 at -21%. However, Santa Clara County is part of Silicon Valley, and is one of the wealthiest counties in the country with a median household income of $133,000 in 2019. Wayne County, MI, home to Detroit, is substantially less affluent with a median household income of $51,000. However, rents increased 22% from a year ago in Wayne County- almost the exact opposite amount from Santa Clara County. Despite falling on opposite ends of the income distribution, rents went down dramatically for wealthy Santa Clara County but increased dramatically for less affluent Wayne County.
In general, this systematic disconnect between income and rent growth in 2020 across the country likely resulted in an aggregate decrease in housing affordability.
However, rents did not increase for all lower income Americans and decrease for all higher income Americans. Another effect at play is the divergence in rent change between urban and non-urban places. Counties where rents declined tended to skew more urban while counties where rents increased tended to skew less urban. There were a cluster of counties with median income levels below $70,000 that benefitted from urban price declines in 2020 such as Cook County, IL ($69K, -4%), Miami-Dade County, FL ($55k, -7%), and Bronx County, NY ($41K, -4%). Similarly, there were some very wealthy suburban counties that saw rents increase, such as Loudoun County, VA ($152K, +8%) and Suffolk County, NY ($106K, +6%).
Even when comparing counties of the same level of urbanization, the relationship between rent growth and income is still strong. “Controlling” for urbanization yields a trendline of -2.1% per $10,000 increase in median household income (p<0.001, r2=0.23). The implication is that rents increased more in less affluent urban areas as well less affluent rural areas.
Additionally, outliers to the relationship between rent growth and income can be explained by the “neighboring cities” effect. This effect is a 2020 migration pattern where people who moved out of hyper-expensive regions generally moved to nearby places that were relatively cheaper. The neighboring cities effect in New York City, for example, explains two significant and opposite outliers to the above trend: Kings County, NY and Nassau County, NY. Kings County is essentially the borough of Brooklyn while Nassau County is the wealthy, suburban portion of western Long Island that borders Queens. Kings County, in line with the rest of New York City, experienced a large outward migration in 2020. A significant amount of people that left NYC moved to suburban places like Nassau County that had relatively cheaper rents, despite incomes being higher there, on average. The result is that people abandoned an expensive, urban, less wealthy area (Kings County), for a cheaper, suburban, more wealthy area (Nassau County).
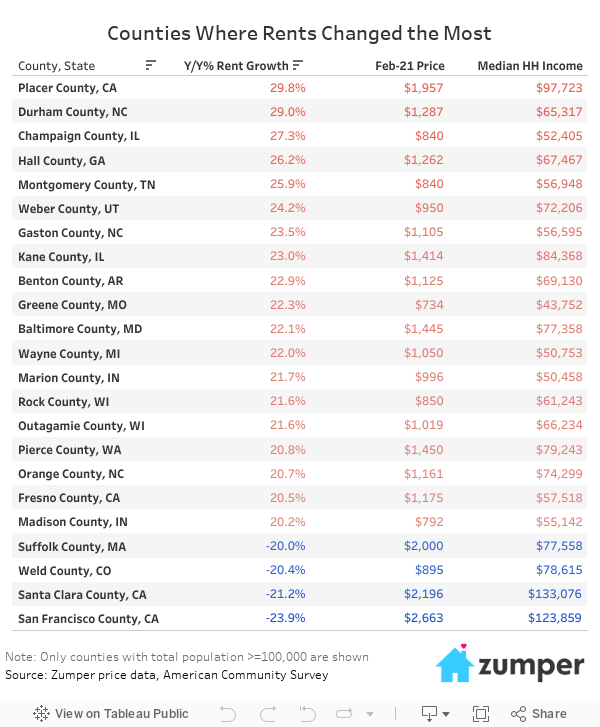
Despite these additional phenomena, the takeaway from the above plot is clear: a large portion of lower income Americans saw their rents go up in 2020 while many more affluent Americans saw their rents go down. Below is a table showing data points at the extremes of this trend- where rents rose or fell the most in 2020:
This Housing Affordability Shift is Unique to 2020
Typically, percentage rent change and income have no relationship because rents grow at a constant percentage on average, or the trend is reversed in times when rents have grown faster in higher income, urban areas. In 2019, for instance, the relationship between percentage rent change and income was flat, or non-existent (-0.3%, p>0.1, r2=0.007).
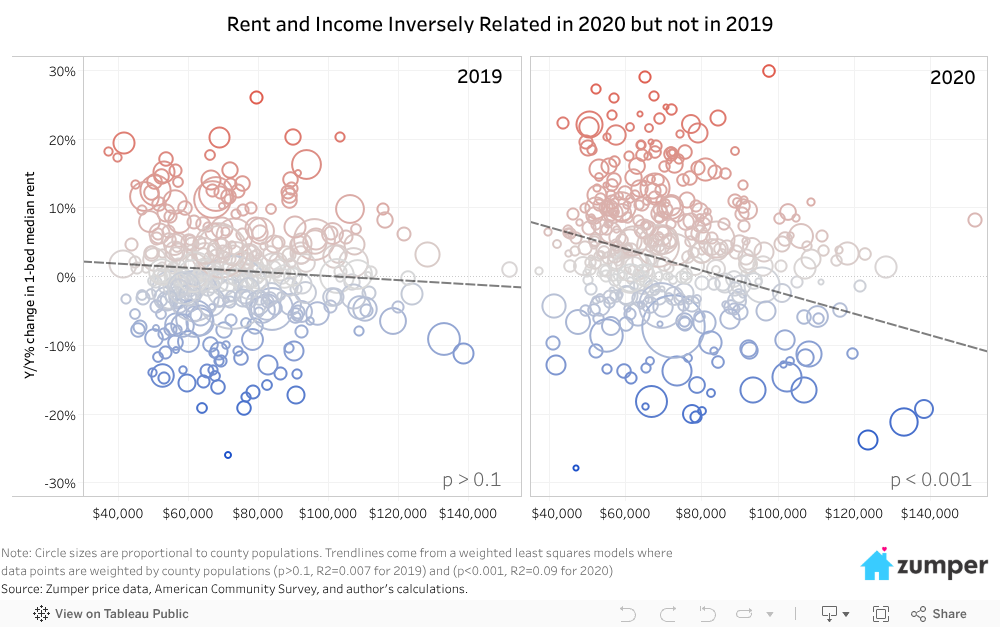
In 2020, the unique migration patterns brought on by the pandemic caused the relationship between income and rents to change, resulting in a decrease in housing affordability.
Rents Increased in the Suburbs and Rural Areas
As mentioned above, rent growth in 2020 differed in urban and non-urban areas. Many people moved out of dense, expensive, urban areas to relatively cheaper, neighboring locations. In addition to cheaper prices, popular destinations also typically offered more space per dollar than places that people left. The increased demand for more space at a lower price was likely related to expanded work from home policies, particularly in urban areas. As employees started commuting to workspaces less and began both living and working in their residences, they searched for living spaces that would accommodate these new needs.
In general, this coalesced as a migration to the suburbs and more rural parts of the country, which caused rents in these regions to significantly outpace rents in urban areas. In the chart below I show average annual rent changes across counties of varying degrees of urbanization using the National Center for Health Statistics (NCHS) Urban-Rural Classification Scheme for Counties.
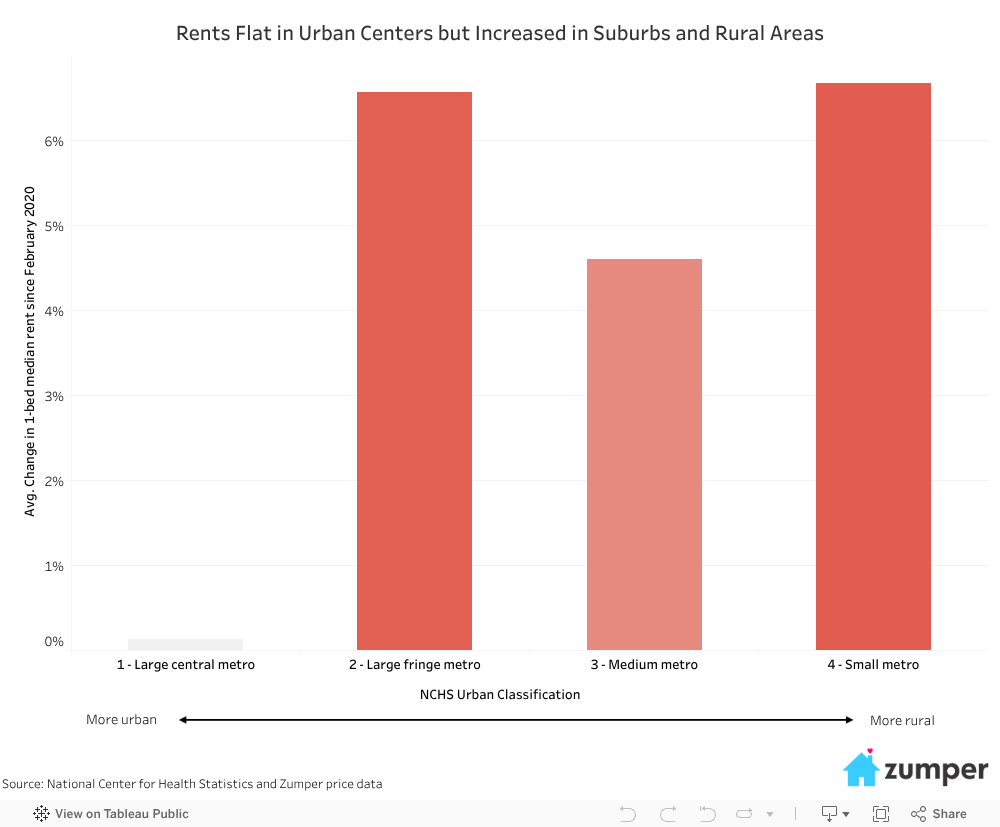
The takeaway here is clear- rents grew substantially in suburban and rural regions while rents stagnated in urban areas. This largely also explains the inverse relationship between income and rents in 2020. Rural areas experienced substantially more rental growth than urban areas, but also are substantially less affluent.
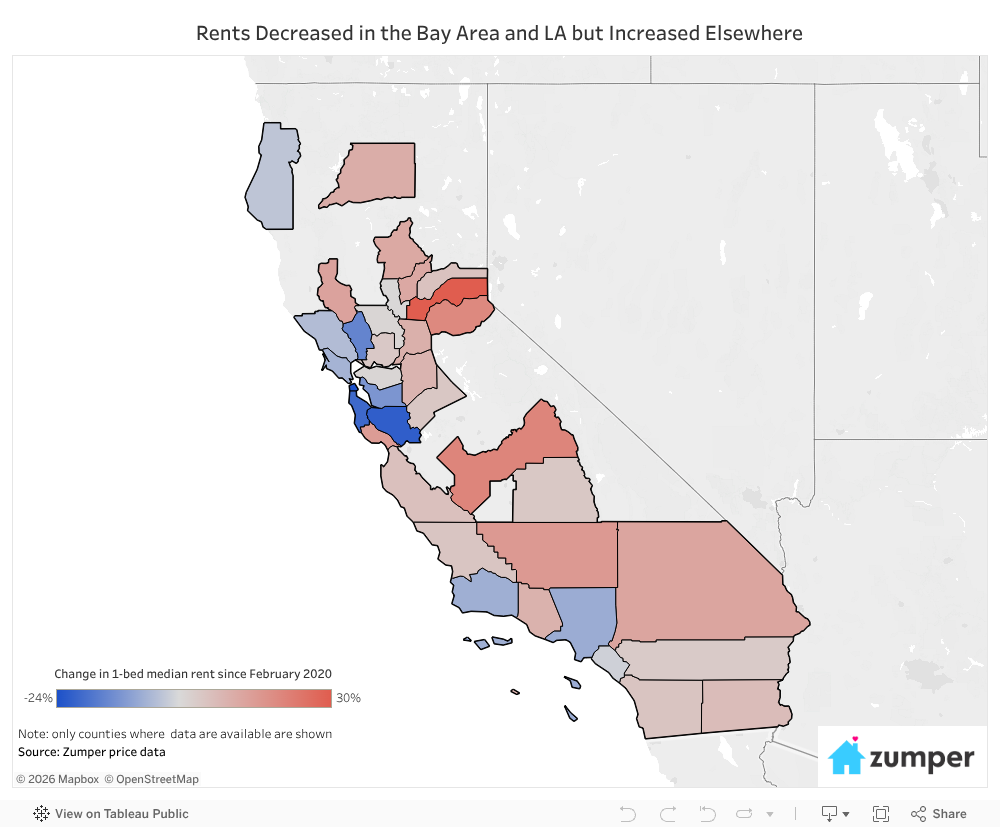
In California, for instance, rents decreased in the affluent counties that make up the San Francisco Bay Area and the Los Angeles area. Meanwhile, rents increased in most other counties outside these wealthy areas. Growth was most highly concentrated near the Tahoe area in Placer County (+29.8%) and El Dorado County (+19.6%), Fresno County (+20.5%), Santa Cruz (+15.0%), and regions outside of Los Angeles including Kent County (+15.6%) and San Bernardino County (+12.8%). These counties all include at least one urban area in some sense, but they are also large counties that include swaths of rural California.
The county level map below shows annual rent changes in California for all available counties:
Conclusions
The coronavirus pandemic and subsequent recession had a much higher impact on lower income Americans than it did on higher income Americans. Housing has become less affordable for lower income Americans and communities of color due to unemployment and financial hardship. However, the pandemic also left lower income Americans worse off by systematically altering rent prices across the country- leaving more rural and suburban renters facing substantially higher rents.
The recent rental and unemployment assistance in the American Rescue Plan and previous assistance from the Cares Act will go a long way to lift this burden- but it may not be enough. 2020 shifted the field in regards to cost of living, and that shift will likely be felt by lower income Americans in 2021 and beyond.
Full Data
| Month | County | State | Median 1-bed Price | Y/Y% Rent Change | Median HH Income | Population | NCHS Urban Category |
|---|---|---|---|---|---|---|---|
| 2/1/2021 | Ada County | Idaho | $1,265 | 17.70% | $72,021 | 481,587 | Medium metro |
| 2/1/2021 | Adams County | Colorado | $1,218 | 18.00% | $75,804 | 517,421 | Large fringe metro |
| 2/1/2021 | Alachua County | Florida | $959 | -5.00% | $49,534 | 269,043 | Medium metro |
| 2/1/2021 | Alameda County | California | $1,995 | -11.30% | $108,322 | 1,671,329 | Large central metro |
| 2/1/2021 | Albany County | New York | $1,275 | 6.30% | $69,953 | 305,506 | Medium metro |
| 2/1/2021 | Albemarle County | Virginia | $1,150 | -4.20% | $86,399 | 109,330 | Small metro |
| 2/1/2021 | Alexandria city | Virginia | $1,800 | -12.40% | $103,284 | 159,428 | Large central metro |
| 2/1/2021 | Allegheny County | Pennsylvania | $1,000 | 0.10% | $64,871 | 1,216,045 | Large central metro |
| 2/1/2021 | Allen County | Indiana | $750 | 13.20% | $56,519 | 379,299 | Medium metro |
| 2/1/2021 | Anchorage Municipality | Alaska | $995 | 6.60% | $82,716 | 288,000 | Medium metro |
| 2/1/2021 | Anne Arundel County | Maryland | $1,675 | 4.60% | $101,147 | 579,234 | Large fringe metro |
| 2/1/2021 | Anoka County | Minnesota | $1,122 | -1.10% | $83,353 | 356,921 | Large fringe metro |
| 2/1/2021 | Arapahoe County | Colorado | $1,250 | 4.30% | $82,710 | 656,590 | Large fringe metro |
| 2/1/2021 | Arlington County | Virginia | $1,953 | -11.20% | $119,755 | 236,842 | Large central metro |
| 2/1/2021 | Atlantic County | New Jersey | $1,189 | 8.10% | $63,389 | 263,670 | Medium metro |
| 2/1/2021 | Baltimore city | Maryland | $1,454 | 18.60% | $50,177 | 593,490 | Large central metro |
| 2/1/2021 | Baltimore County | Maryland | $1,445 | 22.10% | $77,358 | 827,370 | Large fringe metro |
| 2/1/2021 | Bay County | Florida | $1,145 | 0.00% | $59,450 | 174,705 | Small metro |
| 2/1/2021 | Beaufort County | South Carolina | $1,305 | 17.00% | $74,127 | 192,122 | Small metro |
| 2/1/2021 | Bedford County | Virginia | $791 | -7.00% | $69,125 | 78,997 | Medium metro |
| 2/1/2021 | Bell County | Texas | $595 | 3.50% | $54,560 | 362,924 | Medium metro |
| 2/1/2021 | Benton County | Oregon | $895 | 0.00% | $70,835 | 93,053 | Small metro |
| 2/1/2021 | Benton County | Arkansas | $1,125 | 22.90% | $69,130 | 279,141 | Medium metro |
| 2/1/2021 | Bergen County | New Jersey | $2,100 | 2.40% | $108,827 | 932,202 | Large fringe metro |
| 2/1/2021 | Berkeley County | South Carolina | $1,175 | 3.80% | $69,398 | 227,907 | Medium metro |
| 2/1/2021 | Berks County | Pennsylvania | $980 | 11.40% | $67,708 | 421,164 | Medium metro |
| 2/1/2021 | Bernalillo County | New Mexico | $790 | 9.90% | $56,115 | 679,121 | Medium metro |
| 2/1/2021 | Bexar County | Texas | $970 | 10.10% | $58,964 | 2,003,554 | Large central metro |
| 2/1/2021 | Bibb County | Georgia | $855 | 4.60% | $42,140 | 153,159 | Small metro |
| 2/1/2021 | Black Hawk County | Iowa | $585 | 10.40% | $60,506 | 131,228 | Small metro |
| 2/1/2021 | Boone County | Missouri | $600 | 9.10% | $57,013 | 180,463 | Small metro |
| 2/1/2021 | Boone County | Indiana | $1,140 | 24.60% | $70,813 | 67,843 | Large fringe metro |
| 2/1/2021 | Bossier Parish | Louisiana | $873 | 0.40% | $49,962 | 127,039 | Medium metro |
| 2/1/2021 | Boulder County | Colorado | $1,500 | -4.80% | $88,535 | 326,196 | Medium metro |
| 2/1/2021 | Brazoria County | Texas | $1,024 | 3.90% | $84,904 | 374,264 | Large fringe metro |
| 2/1/2021 | Brazos County | Texas | $725 | -13.60% | $55,121 | 229,211 | Small metro |
| 2/1/2021 | Brevard County | Florida | $1,233 | 3.00% | $57,305 | 601,942 | Medium metro |
| 2/1/2021 | Bristol County | Massachusetts | $1,425 | 9.60% | $70,402 | 565,217 | Large fringe metro |
| 2/1/2021 | Bronx County | New York | $1,625 | -4.40% | $41,432 | 1,418,207 | Large central metro |
| 2/1/2021 | Broomfield County | Colorado | $1,774 | -0.80% | $111,400 | 70,465 | Large fringe metro |
| 2/1/2021 | Broward County | Florida | $1,395 | -0.40% | $61,502 | 1,952,778 | Large fringe metro |
| 2/1/2021 | Brown County | Wisconsin | $695 | 0.00% | $64,458 | 264,542 | Medium metro |
| 2/1/2021 | Bucks County | Pennsylvania | $1,250 | -0.70% | $93,767 | 628,270 | Large fringe metro |
| 2/1/2021 | Buncombe County | North Carolina | $1,120 | 6.80% | $54,970 | 261,191 | Medium metro |
| 2/1/2021 | Burleigh County | North Dakota | $790 | 17.90% | $72,494 | 95,626 | Small metro |
| 2/1/2021 | Burlington County | New Jersey | $1,625 | 10.90% | $88,797 | 445,349 | Large fringe metro |
| 2/1/2021 | Butler County | Ohio | $879 | 14.00% | $68,584 | 383,134 | Large fringe metro |
| 2/1/2021 | Butte County | California | $950 | 11.80% | $62,563 | 219,186 | Small metro |
| 2/1/2021 | Cabarrus County | North Carolina | $1,140 | 17.80% | $72,333 | 216,453 | Large fringe metro |
| 2/1/2021 | Caddo Parish | Louisiana | $669 | 6.10% | $45,537 | 240,204 | Medium metro |
| 2/1/2021 | Camden County | New Jersey | $1,100 | 8.90% | $73,672 | 506,471 | Large fringe metro |
| 2/1/2021 | Cameron County | Texas | $587 | -9.70% | $41,123 | 423,163 | Medium metro |
| 2/1/2021 | Campbell County | Kentucky | $1,285 | 4.00% | $66,439 | 93,584 | Large fringe metro |
| 2/1/2021 | Carver County | Minnesota | $1,095 | -12.90% | $101,434 | 105,089 | Large fringe metro |
| 2/1/2021 | Cass County | North Dakota | $685 | -1.40% | $62,218 | 181,923 | Small metro |
| 2/1/2021 | Centre County | Pennsylvania | $995 | 4.20% | $60,706 | 162,385 | Small metro |
| 2/1/2021 | Champaign County | Illinois | $840 | 27.30% | $52,405 | 209,689 | Small metro |
| 2/1/2021 | Charleston County | South Carolina | $1,468 | 5.00% | $71,531 | 411,406 | Medium metro |
| 2/1/2021 | Chatham County | Georgia | $1,075 | 4.50% | $57,611 | 289,430 | Medium metro |
| 2/1/2021 | Chatham County | North Carolina | $1,300 | 19.50% | $66,857 | 74,470 | Medium metro |
| 2/1/2021 | Cherokee County | Georgia | $1,369 | 14.90% | $86,404 | 258,773 | Large fringe metro |
| 2/1/2021 | Chesapeake city | Virginia | $1,235 | 3.30% | $77,847 | 244,835 | Large fringe metro |
| 2/1/2021 | Chester County | Pennsylvania | $1,644 | 5.40% | $102,016 | 524,989 | Large fringe metro |
| 2/1/2021 | Chesterfield County | Virginia | $1,185 | 8.30% | $81,297 | 352,802 | Large fringe metro |
| 2/1/2021 | Chittenden County | Vermont | $1,400 | -3.40% | $76,806 | 163,774 | Small metro |
| 2/1/2021 | Clackamas County | Oregon | $1,285 | -1.00% | $80,294 | 418,187 | Large fringe metro |
| 2/1/2021 | Clark County | Nevada | $1,143 | 5.10% | $62,107 | 2,266,715 | Large central metro |
| 2/1/2021 | Clark County | Washington | $1,290 | 5.60% | $80,555 | 488,241 | Large fringe metro |
| 2/1/2021 | Clarke County | Georgia | $905 | 6.50% | $39,799 | 128,331 | Small metro |
| 2/1/2021 | Clay County | Missouri | $934 | 16.00% | $70,253 | 249,948 | Large fringe metro |
| 2/1/2021 | Clayton County | Georgia | $850 | -1.90% | $51,093 | 292,256 | Large fringe metro |
| 2/1/2021 | Clermont County | Ohio | $828 | -2.10% | $67,744 | 206,428 | Large fringe metro |
| 2/1/2021 | Cleveland County | Oklahoma | $675 | 6.30% | $64,290 | 284,014 | Large fringe metro |
| 2/1/2021 | Clinton County | Michigan | $777 | -2.00% | $69,651 | 79,595 | Medium metro |
| 2/1/2021 | Cobb County | Georgia | $1,260 | 6.10% | $79,601 | 760,141 | Large fringe metro |
| 2/1/2021 | Coconino County | Arizona | $1,310 | 2.10% | $58,085 | 143,476 | Small metro |
| 2/1/2021 | Collier County | Florida | $1,375 | 0.30% | $76,025 | 384,902 | Medium metro |
| 2/1/2021 | Collin County | Texas | $1,300 | 1.50% | $96,134 | 1,034,730 | Large central metro |
| 2/1/2021 | Columbia County | Georgia | $1,064 | 18.20% | $88,761 | 156,714 | Medium metro |
| 2/1/2021 | Comal County | Texas | $1,075 | 10.80% | $89,315 | 156,209 | Large fringe metro |
| 2/1/2021 | Contra Costa County | California | $1,995 | 1.10% | $107,135 | 1,153,526 | Large fringe metro |
| 2/1/2021 | Cook County | Illinois | $1,450 | -4.30% | $69,429 | 5,150,233 | Large central metro |
| 2/1/2021 | Cumberland County | Pennsylvania | $900 | -4.30% | $75,391 | 253,370 | Medium metro |
| 2/1/2021 | Cumberland County | Maine | $1,395 | -0.40% | $76,059 | 295,003 | Medium metro |
| 2/1/2021 | Cumberland County | North Carolina | $829 | 9.10% | $46,292 | 335,509 | Medium metro |
| 2/1/2021 | Cuyahoga County | Ohio | $950 | 9.80% | $52,423 | 1,235,072 | Large central metro |
| 2/1/2021 | Dakota County | Minnesota | $1,288 | -1.90% | $88,864 | 429,021 | Large fringe metro |
| 2/1/2021 | Dallas County | Iowa | $988 | -0.90% | $94,885 | 93,453 | Medium metro |
| 2/1/2021 | Dallas County | Texas | $1,275 | 1.60% | $61,796 | 2,635,516 | Large central metro |
| 2/1/2021 | Dane County | Wisconsin | $1,145 | -4.00% | $77,504 | 546,695 | Medium metro |
| 2/1/2021 | Dauphin County | Pennsylvania | $908 | 3.70% | $60,733 | 278,299 | Medium metro |
| 2/1/2021 | Davidson County | Tennessee | $1,354 | -3.20% | $63,938 | 694,144 | Large central metro |
| 2/1/2021 | DeKalb County | Georgia | $1,452 | 12.80% | $63,652 | 759,297 | Large fringe metro |
| 2/1/2021 | Delaware County | Indiana | $600 | 3.30% | $45,065 | 114,135 | Small metro |
| 2/1/2021 | Delaware County | Ohio | $1,213 | 4.40% | $107,854 | 209,177 | Large fringe metro |
| 2/1/2021 | Delaware County | Pennsylvania | $1,075 | 8.00% | $77,339 | 566,747 | Large fringe metro |
| 2/1/2021 | Denton County | Texas | $1,120 | -1.30% | $90,523 | 887,207 | Large fringe metro |
| 2/1/2021 | Denver County | Colorado | $1,509 | -6.60% | $75,646 | 727,211 | Large central metro |
| 2/1/2021 | District of Columbia | District of Columbia | $2,107 | -10.60% | $92,266 | 705,749 | Large central metro |
| 2/1/2021 | Dodge County | Wisconsin | $750 | -0.70% | $61,300 | 87,839 | Micropolitan |
| 2/1/2021 | Dorchester County | South Carolina | $1,068 | -1.70% | $68,200 | 162,809 | Medium metro |
| 2/1/2021 | Douglas County | Kansas | $685 | -4.20% | $64,233 | 122,259 | Small metro |
| 2/1/2021 | Douglas County | Nebraska | $835 | -1.80% | $67,133 | 571,327 | Medium metro |
| 2/1/2021 | Douglas County | Colorado | $1,615 | 3.20% | $122,867 | 351,154 | Large fringe metro |
| 2/1/2021 | DuPage County | Illinois | $1,394 | 3.50% | $96,403 | 922,921 | Large fringe metro |
| 2/1/2021 | Durham County | North Carolina | $1,287 | 29.00% | $65,317 | 321,488 | Medium metro |
| 2/1/2021 | Dutchess County | New York | $1,505 | 7.50% | $85,901 | 294,218 | Large fringe metro |
| 2/1/2021 | Duval County | Florida | $1,005 | 10.10% | $58,415 | 957,755 | Large central metro |
| 2/1/2021 | East Baton Rouge Parish | Louisiana | $948 | 10.80% | $56,451 | 440,059 | Medium metro |
| 2/1/2021 | Eaton County | Michigan | $660 | -18.90% | $65,409 | 110,268 | Medium metro |
| 2/1/2021 | El Paso County | Texas | $700 | 1.40% | $48,903 | 839,238 | Medium metro |
| 2/1/2021 | El Paso County | Colorado | $1,150 | 16.20% | $72,830 | 720,403 | Medium metro |
| 2/1/2021 | Ellis County | Texas | $970 | -3.40% | $78,797 | 184,826 | Large fringe metro |
| 2/1/2021 | Erie County | New York | $1,025 | -2.80% | $60,652 | 918,702 | Large central metro |
| 2/1/2021 | Erie County | Pennsylvania | $630 | 5.00% | $51,818 | 269,728 | Medium metro |
| 2/1/2021 | Escambia County | Florida | $1,069 | 10.30% | $53,136 | 318,316 | Medium metro |
| 2/1/2021 | Essex County | New Jersey | $1,525 | -1.30% | $64,626 | 798,975 | Large central metro |
| 2/1/2021 | Essex County | Massachusetts | $1,793 | 1.00% | $83,810 | 789,034 | Large fringe metro |
| 2/1/2021 | Fairfax County | Virginia | $1,900 | 1.20% | $128,374 | 1,147,532 | Large fringe metro |
| 2/1/2021 | Fairfield County | Connecticut | $1,773 | -5.10% | $97,053 | 943,332 | Medium metro |
| 2/1/2021 | Fayette County | Kentucky | $756 | 0.10% | $58,356 | 323,152 | Medium metro |
| 2/1/2021 | Forsyth County | North Carolina | $835 | 2.00% | $52,017 | 382,295 | Medium metro |
| 2/1/2021 | Forsyth County | Georgia | $1,509 | 3.70% | $112,108 | 244,252 | Large fringe metro |
| 2/1/2021 | Fort Bend County | Texas | $1,138 | -2.50% | $101,293 | 811,688 | Large fringe metro |
| 2/1/2021 | Franklin County | Ohio | $900 | 2.30% | $64,713 | 1,316,756 | Large central metro |
| 2/1/2021 | Fresno County | California | $1,175 | 20.50% | $57,518 | 999,101 | Medium metro |
| 2/1/2021 | Fulton County | Georgia | $1,602 | 3.40% | $80,013 | 1,063,937 | Large central metro |
| 2/1/2021 | Galveston County | Texas | $895 | -0.20% | $74,977 | 342,139 | Large fringe metro |
| 2/1/2021 | Gaston County | North Carolina | $1,105 | 23.50% | $56,595 | 224,529 | Large fringe metro |
| 2/1/2021 | Genesee County | Michigan | $719 | 6.90% | $50,389 | 405,813 | Medium metro |
| 2/1/2021 | Grand Forks County | North Dakota | $724 | -2.00% | $56,622 | 69,451 | Small metro |
| 2/1/2021 | Greene County | Ohio | $735 | 5.00% | $67,394 | 168,937 | Medium metro |
| 2/1/2021 | Greene County | Missouri | $734 | 22.30% | $43,752 | 293,086 | Medium metro |
| 2/1/2021 | Greenville County | South Carolina | $1,025 | 0.60% | $64,412 | 523,542 | Medium metro |
| 2/1/2021 | Guadalupe County | Texas | $1,030 | 8.40% | $79,768 | 166,847 | Large fringe metro |
| 2/1/2021 | Guilford County | North Carolina | $803 | 9.90% | $55,328 | 537,174 | Medium metro |
| 2/1/2021 | Gwinnett County | Georgia | $1,283 | 10.30% | $72,109 | 936,250 | Large fringe metro |
| 2/1/2021 | Hall County | Georgia | $1,262 | 26.20% | $67,467 | 204,441 | Small metro |
| 2/1/2021 | Hamilton County | Tennessee | $995 | -2.90% | $57,502 | 367,804 | Medium metro |
| 2/1/2021 | Hamilton County | Ohio | $900 | -2.70% | $60,198 | 817,473 | Large central metro |
| 2/1/2021 | Hamilton County | Indiana | $1,116 | -0.90% | $105,062 | 338,011 | Large fringe metro |
| 2/1/2021 | Hampden County | Massachusetts | $1,000 | -7.00% | $60,161 | 466,372 | Medium metro |
| 2/1/2021 | Hancock County | Indiana | $790 | 9.00% | $69,392 | 78,168 | Large fringe metro |
| 2/1/2021 | Harris County | Texas | $1,135 | 0.60% | $61,618 | 4,713,325 | Large central metro |
| 2/1/2021 | Harrison County | Mississippi | $765 | -0.60% | $50,119 | 208,080 | Medium metro |
| 2/1/2021 | Hartford County | Connecticut | $1,195 | -2.40% | $75,381 | 891,720 | Large central metro |
| 2/1/2021 | Hays County | Texas | $1,074 | 7.50% | $72,058 | 230,191 | Large fringe metro |
| 2/1/2021 | Hendricks County | Indiana | $1,089 | 3.30% | $85,381 | 170,311 | Large fringe metro |
| 2/1/2021 | Hennepin County | Minnesota | $1,260 | -9.70% | $82,369 | 1,265,843 | Large central metro |
| 2/1/2021 | Henrico County | Virginia | $1,375 | 18.90% | $68,024 | 330,818 | Large fringe metro |
| 2/1/2021 | Henry County | Georgia | $1,281 | 18.00% | $71,939 | 234,561 | Large fringe metro |
| 2/1/2021 | Hidalgo County | Texas | $605 | -12.90% | $41,800 | 868,707 | Medium metro |
| 2/1/2021 | Hillsborough County | Florida | $1,255 | 5.10% | $61,154 | 1,471,968 | Large central metro |
| 2/1/2021 | Hillsborough County | New Hampshire | $1,492 | 15.20% | $83,626 | 417,025 | Medium metro |
| 2/1/2021 | Hinds County | Mississippi | $760 | 6.30% | $44,964 | 231,840 | Medium metro |
| 2/1/2021 | Honolulu County | Hawaii | $1,500 | -6.30% | $87,470 | 974,563 | Medium metro |
| 2/1/2021 | Houston County | Georgia | $690 | 14.00% | $66,740 | 157,863 | Small metro |
| 2/1/2021 | Howard County | Maryland | $1,721 | -1.50% | $121,618 | 325,690 | Large fringe metro |
| 2/1/2021 | Howard County | Indiana | $601 | 0.30% | $53,440 | 82,544 | Small metro |
| 2/1/2021 | Hudson County | New Jersey | $1,900 | -15.90% | $78,808 | 672,391 | Large central metro |
| 2/1/2021 | Hunterdon County | New Jersey | $1,350 | 3.80% | $116,155 | 124,371 | Large fringe metro |
| 2/1/2021 | Ingham County | Michigan | $795 | 0.90% | $54,395 | 292,406 | Medium metro |
| 2/1/2021 | Jackson County | Missouri | $1,050 | 5.50% | $57,936 | 703,011 | Large central metro |
| 2/1/2021 | Jackson County | Georgia | $795 | 13.60% | $65,063 | 72,977 | Micropolitan |
| 2/1/2021 | Jefferson County | Colorado | $1,340 | -5.20% | $90,040 | 582,881 | Large fringe metro |
| 2/1/2021 | Jefferson County | Texas | $764 | -3.90% | $55,797 | 251,565 | Medium metro |
| 2/1/2021 | Jefferson County | Kentucky | $895 | 9.10% | $59,049 | 766,757 | Large central metro |
| 2/1/2021 | Jefferson Parish | Louisiana | $868 | -3.10% | $56,069 | 432,493 | Large fringe metro |
| 2/1/2021 | Johnson County | Texas | $999 | -3.30% | $66,319 | 175,817 | Large fringe metro |
| 2/1/2021 | Johnson County | Kansas | $1,013 | 2.80% | $91,771 | 602,401 | Large fringe metro |
| 2/1/2021 | Johnson County | Iowa | $910 | 17.40% | $66,011 | 151,140 | Small metro |
| 2/1/2021 | Johnston County | North Carolina | $1,045 | 17.40% | $60,951 | 209,339 | Large fringe metro |
| 2/1/2021 | Kalamazoo County | Michigan | $789 | 8.80% | $56,441 | 265,066 | Medium metro |
| 2/1/2021 | Kane County | Illinois | $1,414 | 23.00% | $84,368 | 532,403 | Large fringe metro |
| 2/1/2021 | Kendall County | Illinois | $1,399 | 8.40% | $104,858 | 128,990 | Large fringe metro |
| 2/1/2021 | Kenosha County | Wisconsin | $1,249 | 5.10% | $65,997 | 169,561 | Large fringe metro |
| 2/1/2021 | Kent County | Michigan | $1,001 | -4.20% | $66,532 | 656,955 | Large central metro |
| 2/1/2021 | Kenton County | Kentucky | $820 | 5.80% | $68,849 | 166,998 | Large fringe metro |
| 2/1/2021 | Kern County | California | $925 | 15.60% | $53,067 | 900,202 | Medium metro |
| 2/1/2021 | King County | Washington | $1,595 | -14.70% | $102,594 | 2,252,782 | Large central metro |
| 2/1/2021 | Kings County | New York | $2,108 | -18.20% | $66,937 | 2,559,903 | Large central metro |
| 2/1/2021 | Kitsap County | Washington | $1,295 | -5.80% | $79,624 | 271,473 | Medium metro |
| 2/1/2021 | Knox County | Tennessee | $849 | 3.70% | $60,283 | 470,313 | Medium metro |
| 2/1/2021 | Lafayette Parish | Louisiana | $868 | 8.60% | $60,567 | 244,390 | Medium metro |
| 2/1/2021 | Lake County | Illinois | $1,235 | -10.90% | $92,511 | 696,535 | Large fringe metro |
| 2/1/2021 | Lake County | Florida | $1,137 | 3.40% | $57,588 | 367,118 | Large fringe metro |
| 2/1/2021 | Lake County | Indiana | $843 | 13.90% | $57,081 | 485,493 | Large fringe metro |
| 2/1/2021 | Lancaster County | Nebraska | $812 | -5.60% | $61,175 | 319,090 | Medium metro |
| 2/1/2021 | Lancaster County | Pennsylvania | $1,050 | 12.30% | $67,376 | 545,724 | Medium metro |
| 2/1/2021 | Lane County | Oregon | $895 | -0.60% | $57,325 | 382,067 | Medium metro |
| 2/1/2021 | Larimer County | Colorado | $1,374 | 14.00% | $75,186 | 356,899 | Medium metro |
| 2/1/2021 | Lee County | Florida | $1,200 | 1.50% | $62,240 | 770,577 | Medium metro |
| 2/1/2021 | Lee County | Alabama | $670 | 3.10% | $53,712 | 164,542 | Small metro |
| 2/1/2021 | Lehigh County | Pennsylvania | $1,110 | 0.80% | $65,667 | 369,318 | Medium metro |
| 2/1/2021 | Leon County | Florida | $800 | 0.00% | $54,929 | 293,582 | Medium metro |
| 2/1/2021 | Lexington County | South Carolina | $850 | -14.80% | $61,631 | 298,750 | Medium metro |
| 2/1/2021 | Linn County | Iowa | $579 | 10.30% | $63,559 | 226,706 | Medium metro |
| 2/1/2021 | Lorain County | Ohio | $589 | 3.50% | $58,686 | 309,833 | Large fringe metro |
| 2/1/2021 | Los Angeles County | California | $1,851 | -7.40% | $72,797 | 10,039,107 | Large central metro |
| 2/1/2021 | Loudoun County | Virginia | $1,741 | 8.20% | $151,800 | 413,538 | Large fringe metro |
| 2/1/2021 | Lubbock County | Texas | $645 | 0.80% | $55,003 | 310,569 | Medium metro |
| 2/1/2021 | Lucas County | Ohio | $629 | 4.10% | $49,448 | 428,348 | Medium metro |
| 2/1/2021 | Lynchburg city | Virginia | $867 | 13.30% | $54,850 | 82,168 | Medium metro |
| 2/1/2021 | Macomb County | Michigan | $855 | 6.80% | $64,947 | 873,972 | Large fringe metro |
| 2/1/2021 | Madison County | Alabama | $923 | 18.00% | $67,930 | 372,909 | Medium metro |
| 2/1/2021 | Madison County | Indiana | $792 | 20.20% | $55,142 | 129,569 | Large fringe metro |
| 2/1/2021 | Manatee County | Florida | $1,286 | 10.40% | $64,499 | 403,253 | Medium metro |
| 2/1/2021 | Marathon County | Wisconsin | $805 | 7.30% | $65,851 | 135,692 | Small metro |
| 2/1/2021 | Maricopa County | Arizona | $1,150 | 4.40% | $68,649 | 4,485,414 | Large central metro |
| 2/1/2021 | Marin County | California | $2,250 | -6.30% | $110,843 | 258,826 | Large fringe metro |
| 2/1/2021 | Marion County | Oregon | $1,000 | 17.60% | $64,306 | 347,818 | Medium metro |
| 2/1/2021 | Marion County | Indiana | $996 | 21.70% | $50,458 | 964,582 | Large central metro |
| 2/1/2021 | Martin County | Florida | $1,250 | 8.70% | $70,842 | 161,000 | Medium metro |
| 2/1/2021 | Mason County | Washington | $1,050 | 23.50% | $63,983 | 66,768 | Micropolitan |
| 2/1/2021 | McLean County | Illinois | $595 | 0.00% | $68,784 | 171,517 | Small metro |
| 2/1/2021 | McLennan County | Texas | $805 | 1.90% | $50,845 | 256,623 | Medium metro |
| 2/1/2021 | Mecklenburg County | North Carolina | $1,317 | 4.60% | $69,072 | 1,110,356 | Large central metro |
| 2/1/2021 | Medina County | Ohio | $700 | -11.90% | $76,468 | 179,746 | Large fringe metro |
| 2/1/2021 | Mercer County | New Jersey | $1,449 | 7.30% | $79,492 | 367,430 | Medium metro |
| 2/1/2021 | Miami-Dade County | Florida | $1,553 | -8.60% | $55,171 | 2,716,940 | Large central metro |
| 2/1/2021 | Middlesex County | Massachusetts | $1,918 | -16.60% | $107,056 | 1,611,699 | Large fringe metro |
| 2/1/2021 | Middlesex County | New Jersey | $1,720 | 4.30% | $93,418 | 825,062 | Large fringe metro |
| 2/1/2021 | Midland County | Texas | $1,035 | -17.00% | $82,558 | 176,832 | Small metro |
| 2/1/2021 | Milwaukee County | Wisconsin | $1,210 | -4.30% | $53,418 | 945,726 | Large central metro |
| 2/1/2021 | Minnehaha County | South Dakota | $701 | 0.80% | $61,968 | 193,134 | Small metro |
| 2/1/2021 | Mobile County | Alabama | $896 | 19.50% | $49,639 | 413,210 | Medium metro |
| 2/1/2021 | Monmouth County | New Jersey | $1,750 | 9.40% | $102,870 | 618,795 | Large fringe metro |
| 2/1/2021 | Monongalia County | West Virginia | $700 | 7.70% | $55,940 | 105,612 | Small metro |
| 2/1/2021 | Monroe County | Indiana | $805 | -3.50% | $52,453 | 148,431 | Small metro |
| 2/1/2021 | Monroe County | New York | $1,160 | 14.30% | $62,103 | 741,770 | Large central metro |
| 2/1/2021 | Monterey County | California | $1,695 | 6.30% | $77,514 | 434,061 | Medium metro |
| 2/1/2021 | Montgomery County | Maryland | $1,764 | -5.90% | $110,389 | 1,050,688 | Large fringe metro |
| 2/1/2021 | Montgomery County | Texas | $1,050 | -0.40% | $88,695 | 607,391 | Large fringe metro |
| 2/1/2021 | Montgomery County | Pennsylvania | $1,475 | 1.70% | $92,302 | 830,915 | Large fringe metro |
| 2/1/2021 | Montgomery County | Alabama | $708 | 3.00% | $53,117 | 226,486 | Medium metro |
| 2/1/2021 | Montgomery County | Ohio | $675 | 3.80% | $54,537 | 531,687 | Medium metro |
| 2/1/2021 | Montgomery County | Tennessee | $840 | 25.90% | $56,948 | 208,993 | Medium metro |
| 2/1/2021 | Morris County | New Jersey | $1,950 | -4.90% | $116,283 | 491,845 | Large fringe metro |
| 2/1/2021 | Multnomah County | Oregon | $1,355 | -2.90% | $72,900 | 812,855 | Large central metro |
| 2/1/2021 | Muscogee County | Georgia | $777 | 3.60% | $46,934 | 195,769 | Medium metro |
| 2/1/2021 | Nassau County | New York | $2,438 | 3.30% | $118,453 | 1,356,924 | Large fringe metro |
| 2/1/2021 | New Castle County | Delaware | $1,150 | 11.10% | $76,328 | 558,753 | Large fringe metro |
| 2/1/2021 | New Hanover County | North Carolina | $1,200 | 11.70% | $56,382 | 234,473 | Medium metro |
| 2/1/2021 | New Haven County | Connecticut | $1,350 | 5.90% | $69,751 | 854,757 | Medium metro |
| 2/1/2021 | New London County | Connecticut | $1,000 | -6.60% | $75,633 | 265,206 | Medium metro |
| 2/1/2021 | New York County | New York | $2,955 | -16.70% | $93,651 | 1,628,706 | Large central metro |
| 2/1/2021 | Newport News city | Virginia | $988 | 14.40% | $53,029 | 179,225 | Large fringe metro |
| 2/1/2021 | Norfolk city | Virginia | $991 | -6.10% | $53,093 | 242,742 | Large central metro |
| 2/1/2021 | Norfolk County | Massachusetts | $2,095 | -11.80% | $107,361 | 706,775 | Large fringe metro |
| 2/1/2021 | Northampton County | Pennsylvania | $1,295 | -3.40% | $74,328 | 305,285 | Medium metro |
| 2/1/2021 | Nueces County | Texas | $850 | 0.10% | $56,789 | 362,294 | Medium metro |
| 2/1/2021 | Oakland County | Michigan | $1,109 | 15.50% | $81,190 | 1,257,584 | Large fringe metro |
| 2/1/2021 | Ocean County | New Jersey | $1,400 | 7.90% | $76,093 | 607,186 | Large fringe metro |
| 2/1/2021 | Okaloosa County | Florida | $1,250 | 19.00% | $64,222 | 210,738 | Small metro |
| 2/1/2021 | Oklahoma County | Oklahoma | $730 | -7.20% | $56,235 | 797,434 | Large central metro |
| 2/1/2021 | Olmsted County | Minnesota | $1,000 | -19.70% | $80,096 | 158,293 | Small metro |
| 2/1/2021 | Onondaga County | New York | $830 | 3.80% | $61,577 | 460,528 | Medium metro |
| 2/1/2021 | Orange County | New York | $1,400 | -12.50% | $84,458 | 384,940 | Large fringe metro |
| 2/1/2021 | Orange County | Florida | $1,247 | -5.50% | $63,461 | 1,393,452 | Large central metro |
| 2/1/2021 | Orange County | California | $1,985 | -1.20% | $95,934 | 3,175,692 | Large central metro |
| 2/1/2021 | Orange County | North Carolina | $1,161 | 20.70% | $74,299 | 148,476 | Medium metro |
| 2/1/2021 | Orleans Parish | Louisiana | $1,471 | 1.40% | $45,615 | 390,144 | Large central metro |
| 2/1/2021 | Osceola County | Florida | $1,283 | -5.00% | $51,760 | 375,751 | Large fringe metro |
| 2/1/2021 | Ottawa County | Michigan | $1,040 | 4.40% | $68,817 | 291,830 | Large fringe metro |
| 2/1/2021 | Outagamie County | Wisconsin | $1,019 | 21.60% | $66,234 | 187,885 | Small metro |
| 2/1/2021 | Palm Beach County | Florida | $1,400 | 0.00% | $66,623 | 1,496,770 | Large fringe metro |
| 2/1/2021 | Parker County | Texas | $975 | -11.00% | $83,262 | 142,878 | Large fringe metro |
| 2/1/2021 | Pasco County | Florida | $1,252 | 15.90% | $55,828 | 553,947 | Large fringe metro |
| 2/1/2021 | Passaic County | New Jersey | $1,600 | 14.30% | $77,040 | 501,826 | Large fringe metro |
| 2/1/2021 | Peoria County | Illinois | $650 | 9.20% | $57,247 | 179,179 | Medium metro |
| 2/1/2021 | Philadelphia County | Pennsylvania | $1,395 | -6.70% | $47,474 | 1,584,064 | Large central metro |
| 2/1/2021 | Pierce County | Washington | $1,450 | 20.80% | $79,243 | 904,980 | Large fringe metro |
| 2/1/2021 | Pima County | Arizona | $769 | 6.30% | $56,169 | 1,047,279 | Medium metro |
| 2/1/2021 | Pinellas County | Florida | $1,251 | 9.20% | $56,737 | 974,996 | Large central metro |
| 2/1/2021 | Pitt County | North Carolina | $600 | -3.20% | $53,401 | 180,742 | Small metro |
| 2/1/2021 | Placer County | California | $1,957 | 29.80% | $97,723 | 398,329 | Large fringe metro |
| 2/1/2021 | Platte County | Missouri | $1,077 | 9.30% | $81,712 | 104,418 | Large fringe metro |
| 2/1/2021 | Plymouth County | Massachusetts | $2,129 | 10.20% | $90,880 | 521,202 | Large fringe metro |
| 2/1/2021 | Polk County | Iowa | $940 | 5.00% | $66,918 | 490,161 | Medium metro |
| 2/1/2021 | Polk County | Florida | $935 | 8.80% | $51,833 | 724,777 | Medium metro |
| 2/1/2021 | Porter County | Indiana | $914 | -0.60% | $72,483 | 170,389 | Large fringe metro |
| 2/1/2021 | Portsmouth city | Virginia | $1,248 | 8.60% | $51,195 | 94,398 | Large fringe metro |
| 2/1/2021 | Potter County | Texas | $614 | 0.70% | $37,297 | 117,415 | Medium metro |
| 2/1/2021 | Prince George's County | Maryland | $1,435 | -1.00% | $86,290 | 909,327 | Large fringe metro |
| 2/1/2021 | Prince William County | Virginia | $1,506 | -6.00% | $106,861 | 470,335 | Large fringe metro |
| 2/1/2021 | Providence County | Rhode Island | $1,405 | 15.90% | $62,994 | 638,931 | Large central metro |
| 2/1/2021 | Pulaski County | Arkansas | $745 | 5.30% | $52,043 | 391,911 | Medium metro |
| 2/1/2021 | Queens County | New York | $1,825 | -13.90% | $73,696 | 2,253,858 | Large central metro |
| 2/1/2021 | Ramsey County | Minnesota | $1,139 | -3.10% | $68,871 | 550,321 | Large central metro |
| 2/1/2021 | Randall County | Texas | $675 | 10.70% | $70,651 | 137,713 | Medium metro |
| 2/1/2021 | Rensselaer County | New York | $1,200 | -3.10% | $71,574 | 158,714 | Medium metro |
| 2/1/2021 | Richland County | South Carolina | $843 | -10.80% | $52,293 | 415,759 | Medium metro |
| 2/1/2021 | Richmond city | Virginia | $1,295 | 18.30% | $51,285 | 230,436 | Large central metro |
| 2/1/2021 | Richmond County | New York | $1,600 | -2.90% | $89,821 | 476,143 | Large central metro |
| 2/1/2021 | Richmond County | Georgia | $800 | 6.70% | $44,973 | 202,518 | Medium metro |
| 2/1/2021 | Riley County | Kansas | $590 | 2.60% | $50,920 | 74,232 | Small metro |
| 2/1/2021 | Riverside County | California | $1,505 | 3.80% | $73,260 | 2,470,546 | Large central metro |
| 2/1/2021 | Roanoke city | Virginia | $795 | 6.00% | $45,838 | 99,143 | Medium metro |
| 2/1/2021 | Roanoke County | Virginia | $850 | 0.00% | $71,715 | 94,186 | Medium metro |
| 2/1/2021 | Rock County | Wisconsin | $850 | 21.60% | $61,243 | 163,354 | Small metro |
| 2/1/2021 | Rockdale County | Georgia | $953 | 0.80% | $60,560 | 90,896 | Large fringe metro |
| 2/1/2021 | Rockingham County | New Hampshire | $1,395 | 7.30% | $91,249 | 309,769 | Large fringe metro |
| 2/1/2021 | Rockland County | New York | $1,675 | 1.50% | $100,916 | 325,789 | Large fringe metro |
| 2/1/2021 | Rockwall County | Texas | $1,358 | 6.00% | $103,378 | 104,915 | Large fringe metro |
| 2/1/2021 | Rutherford County | Tennessee | $1,099 | 12.40% | $69,397 | 332,285 | Large fringe metro |
| 2/1/2021 | Sacramento County | California | $1,425 | 10.00% | $72,017 | 1,552,058 | Large central metro |
| 2/1/2021 | Salt Lake County | Utah | $1,124 | 3.50% | $80,119 | 1,160,437 | Large central metro |
| 2/1/2021 | San Bernardino County | California | $1,550 | 12.80% | $67,903 | 2,180,085 | Large fringe metro |
| 2/1/2021 | San Diego County | California | $1,789 | 5.30% | $83,985 | 3,338,330 | Large central metro |
| 2/1/2021 | San Francisco County | California | $2,663 | -23.90% | $123,859 | 881,549 | Large central metro |
| 2/1/2021 | San Joaquin County | California | $1,200 | 9.10% | $68,997 | 762,148 | Medium metro |
| 2/1/2021 | San Luis Obispo County | California | $1,550 | 5.10% | $77,265 | 283,111 | Medium metro |
| 2/1/2021 | San Mateo County | California | $2,195 | -19.40% | $138,500 | 766,573 | Large fringe metro |
| 2/1/2021 | Santa Barbara County | California | $1,815 | -6.90% | $75,653 | 446,499 | Medium metro |
| 2/1/2021 | Santa Clara County | California | $2,196 | -21.20% | $133,076 | 1,927,852 | Large central metro |
| 2/1/2021 | Sarasota County | Florida | $1,460 | 7.00% | $66,342 | 433,742 | Medium metro |
| 2/1/2021 | Sarpy County | Nebraska | $903 | 0.80% | $83,720 | 187,196 | Medium metro |
| 2/1/2021 | Schenectady County | New York | $1,248 | 10.90% | $65,773 | 155,299 | Medium metro |
| 2/1/2021 | Scott County | Iowa | $695 | 7.40% | $65,122 | 172,943 | Medium metro |
| 2/1/2021 | Scott County | Minnesota | $1,344 | 10.70% | $108,761 | 149,013 | Large fringe metro |
| 2/1/2021 | Sedgwick County | Kansas | $618 | -13.80% | $59,716 | 516,042 | Medium metro |
| 2/1/2021 | Seminole County | Florida | $1,149 | 1.80% | $70,190 | 471,826 | Large fringe metro |
| 2/1/2021 | Sevier County | Tennessee | $950 | 6.70% | $57,741 | 98,250 | Micropolitan |
| 2/1/2021 | Shawnee County | Kansas | $594 | 3.10% | $59,441 | 176,875 | Small metro |
| 2/1/2021 | Sheboygan County | Wisconsin | $1,000 | -4.80% | $60,706 | 115,340 | Small metro |
| 2/1/2021 | Shelby County | Tennessee | $950 | 11.80% | $52,614 | 937,166 | Large central metro |
| 2/1/2021 | Snohomish County | Washington | $1,393 | -3.60% | $89,260 | 822,083 | Large fringe metro |
| 2/1/2021 | Solano County | California | $1,625 | 4.20% | $86,652 | 447,643 | Medium metro |
| 2/1/2021 | Somerset County | New Jersey | $1,650 | 5.80% | $111,587 | 328,934 | Large fringe metro |
| 2/1/2021 | Sonoma County | California | $1,698 | -4.60% | $87,828 | 494,336 | Medium metro |
| 2/1/2021 | Spartanburg County | South Carolina | $875 | 10.10% | $55,339 | 319,785 | Medium metro |
| 2/1/2021 | Spokane County | Washington | $925 | 12.10% | $59,974 | 522,798 | Medium metro |
| 2/1/2021 | Spotsylvania County | Virginia | $1,518 | 11.00% | $91,073 | 136,215 | Large fringe metro |
| 2/1/2021 | St. Charles County | Missouri | $1,165 | 3.60% | $89,146 | 402,022 | Large fringe metro |
| 2/1/2021 | St. Clair County | Illinois | $691 | 16.60% | $57,169 | 259,686 | Large fringe metro |
| 2/1/2021 | St. Joseph County | Indiana | $1,085 | 11.30% | $53,456 | 271,826 | Medium metro |
| 2/1/2021 | St. Louis city | Missouri | $1,050 | 5.50% | $47,176 | 300,576 | Large central metro |
| 2/1/2021 | St. Louis County | Missouri | $859 | -4.50% | $70,022 | 994,205 | Large fringe metro |
| 2/1/2021 | St. Lucie County | Florida | $1,295 | 4.30% | $58,039 | 328,297 | Medium metro |
| 2/1/2021 | St. Tammany Parish | Louisiana | $1,053 | 8.60% | $69,076 | 260,419 | Large fringe metro |
| 2/1/2021 | Stark County | Ohio | $575 | 2.70% | $55,499 | 370,606 | Medium metro |
| 2/1/2021 | Stearns County | Minnesota | $845 | -12.30% | $66,558 | 161,075 | Small metro |
| 2/1/2021 | Story County | Iowa | $750 | -0.10% | $63,107 | 97,117 | Small metro |
| 2/1/2021 | Suffolk County | Massachusetts | $2,000 | -20.00% | $77,558 | 803,907 | Large central metro |
| 2/1/2021 | Suffolk County | New York | $2,100 | 5.80% | $106,228 | 1,476,601 | Large fringe metro |
| 2/1/2021 | Summit County | Ohio | $708 | 1.90% | $57,364 | 541,013 | Medium metro |
| 2/1/2021 | Sumner County | Tennessee | $1,083 | 8.30% | $68,743 | 191,283 | Large fringe metro |
| 2/1/2021 | Tarrant County | Texas | $1,041 | 5.30% | $70,139 | 2,102,515 | Large central metro |
| 2/1/2021 | Taylor County | Texas | $645 | 7.50% | $55,351 | 138,034 | Small metro |
| 2/1/2021 | Thurston County | Washington | $1,383 | 10.20% | $78,512 | 290,536 | Medium metro |
| 2/1/2021 | Tippecanoe County | Indiana | $780 | 9.90% | $49,352 | 195,732 | Small metro |
| 2/1/2021 | Tolland County | Connecticut | $1,120 | -2.60% | $91,028 | 150,721 | Large fringe metro |
| 2/1/2021 | Tompkins County | New York | $1,100 | -2.70% | $58,626 | 102,180 | Small metro |
| 2/1/2021 | Travis County | Texas | $1,200 | -6.70% | $80,726 | 1,273,954 | Large central metro |
| 2/1/2021 | Tulsa County | Oklahoma | $664 | 2.20% | $57,483 | 651,552 | Medium metro |
| 2/1/2021 | Tuscaloosa County | Alabama | $725 | 7.40% | $52,243 | 209,355 | Small metro |
| 2/1/2021 | Ulster County | New York | $1,250 | 19.00% | $64,087 | 177,573 | Small metro |
| 2/1/2021 | Union County | New Jersey | $1,825 | 7.40% | $80,339 | 556,341 | Large central metro |
| 2/1/2021 | Utah County | Utah | $1,100 | 9.50% | $79,545 | 636,235 | Medium metro |
| 2/1/2021 | Vanderburgh County | Indiana | $625 | 8.10% | $51,350 | 181,451 | Medium metro |
| 2/1/2021 | Ventura County | California | $2,077 | 9.60% | $92,236 | 846,006 | Medium metro |
| 2/1/2021 | Vigo County | Indiana | $550 | 7.80% | $48,013 | 107,038 | Small metro |
| 2/1/2021 | Virginia Beach city | Virginia | $1,250 | 15.70% | $79,054 | 449,974 | Large central metro |
| 2/1/2021 | Volusia County | Florida | $965 | 7.20% | $53,766 | 553,284 | Medium metro |
| 2/1/2021 | Wake County | North Carolina | $1,154 | 3.80% | $84,215 | 1,111,761 | Large central metro |
| 2/1/2021 | Walker County | Texas | $480 | -28.00% | $47,170 | 72,971 | Micropolitan |
| 2/1/2021 | Ward County | North Dakota | $846 | 16.70% | $71,415 | 67,641 | Micropolitan |
| 2/1/2021 | Warren County | Kentucky | $739 | 12.80% | $52,645 | 132,896 | Small metro |
| 2/1/2021 | Warren County | Ohio | $1,233 | 13.20% | $90,837 | 234,602 | Large fringe metro |
| 2/1/2021 | Washington County | Pennsylvania | $650 | -13.30% | $65,431 | 206,865 | Large fringe metro |
| 2/1/2021 | Washington County | Oregon | $1,286 | -1.10% | $85,734 | 601,592 | Large fringe metro |
| 2/1/2021 | Washington County | Arkansas | $747 | 1.00% | $50,798 | 239,187 | Medium metro |
| 2/1/2021 | Washington County | Minnesota | $1,447 | 8.40% | $100,596 | 262,440 | Large fringe metro |
| 2/1/2021 | Washoe County | Nevada | $1,100 | 5.30% | $71,881 | 471,519 | Medium metro |
| 2/1/2021 | Washtenaw County | Michigan | $1,115 | 2.80% | $76,576 | 367,601 | Medium metro |
| 2/1/2021 | Waukesha County | Wisconsin | $1,215 | 9.00% | $90,548 | 404,198 | Large fringe metro |
| 2/1/2021 | Wayne County | Michigan | $1,050 | 22.00% | $50,753 | 1,749,343 | Large central metro |
| 2/1/2021 | Weber County | Utah | $950 | 24.20% | $72,206 | 260,213 | Medium metro |
| 2/1/2021 | Weld County | Colorado | $895 | -20.40% | $78,615 | 324,492 | Medium metro |
| 2/1/2021 | Westchester County | New York | $1,950 | -9.30% | $101,908 | 967,506 | Large fringe metro |
| 2/1/2021 | Westmoreland County | Pennsylvania | $679 | 5.30% | $59,073 | 348,899 | Large fringe metro |
| 2/1/2021 | Whatcom County | Washington | $1,275 | 10.90% | $69,372 | 229,247 | Small metro |
| 2/1/2021 | Wichita County | Texas | $632 | 4.50% | $51,749 | 132,230 | Small metro |
| 2/1/2021 | Will County | Illinois | $1,147 | 4.70% | $90,134 | 690,743 | Large fringe metro |
| 2/1/2021 | Williamson County | Texas | $1,132 | 2.00% | $92,179 | 590,551 | Large fringe metro |
| 2/1/2021 | Williamson County | Tennessee | $1,537 | 2.30% | $115,507 | 238,412 | Large fringe metro |
| 2/1/2021 | Wilson County | Tennessee | $1,173 | 3.70% | $80,071 | 144,657 | Large fringe metro |
| 2/1/2021 | Winnebago County | Illinois | $695 | 3.50% | $59,455 | 282,572 | Medium metro |
| 2/1/2021 | Winnebago County | Wisconsin | $642 | 11.60% | $58,347 | 171,907 | Small metro |
| 2/1/2021 | Worcester County | Massachusetts | $1,395 | 1.50% | $78,345 | 830,622 | Medium metro |
| 2/1/2021 | Wright County | Minnesota | $1,361 | 5.10% | $91,707 | 138,377 | Large fringe metro |
| 2/1/2021 | Yellowstone County | Montana | $695 | 11.20% | $61,186 | 161,300 | Small metro |
| 2/1/2021 | Yolo County | California | $1,476 | 1.10% | $71,417 | 220,500 | Large fringe metro |
| 2/1/2021 | York County | Virginia | $979 | 0.40% | $91,241 | 68,280 | Large fringe metro |
| 2/1/2021 | York County | South Carolina | $1,005 | 2.40% | $66,949 | 280,979 | Large fringe metro |
| 2/1/2021 | York County | Pennsylvania | $850 | 9.70% | $69,172 | 449,058 | Medium metro |
Related content


