The Zumper D.C. Metro Report analyzed over 55,000 active listings in April across 8 metro cities to show the most and least expensive cities and cities with the fastest growing rents.
Cities Ranked By Rent

The Most Expensive
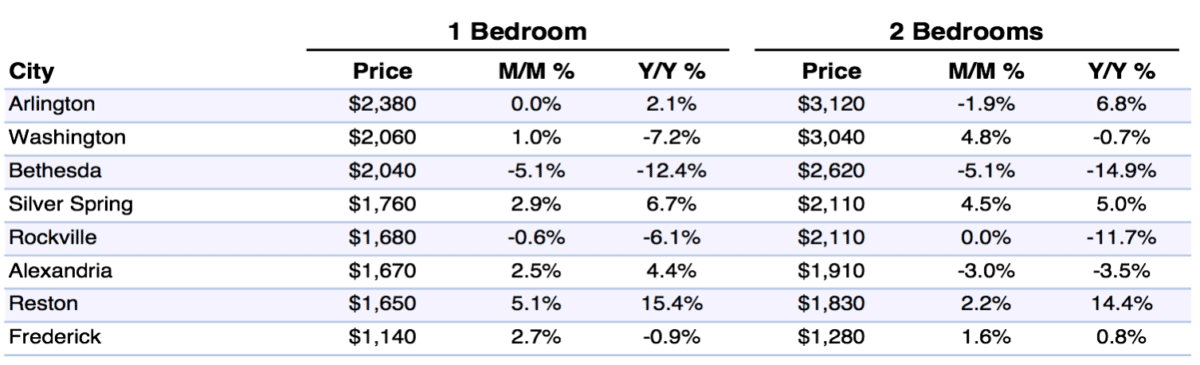
–Arlington, VA continued to reign as the most expensive city in the metro area this month. The median price of one bedroom units here was $2,380.
–Washington, DC climbed ahead of Bethesda this month to become the second most expensive city with rent at $2,060.
–Bethesda, MD ranked as third with rent at $2,040.
The Least Expensive
–Frederick, MD remained the most affordable city with rent at $1,140.
–Reston, VA rent was the second least expensive at $1,650.
–Alexandria, VA, just $20 more expensive than Reston, ranked as third with rent at $1,670.
Yearly Growth Rate
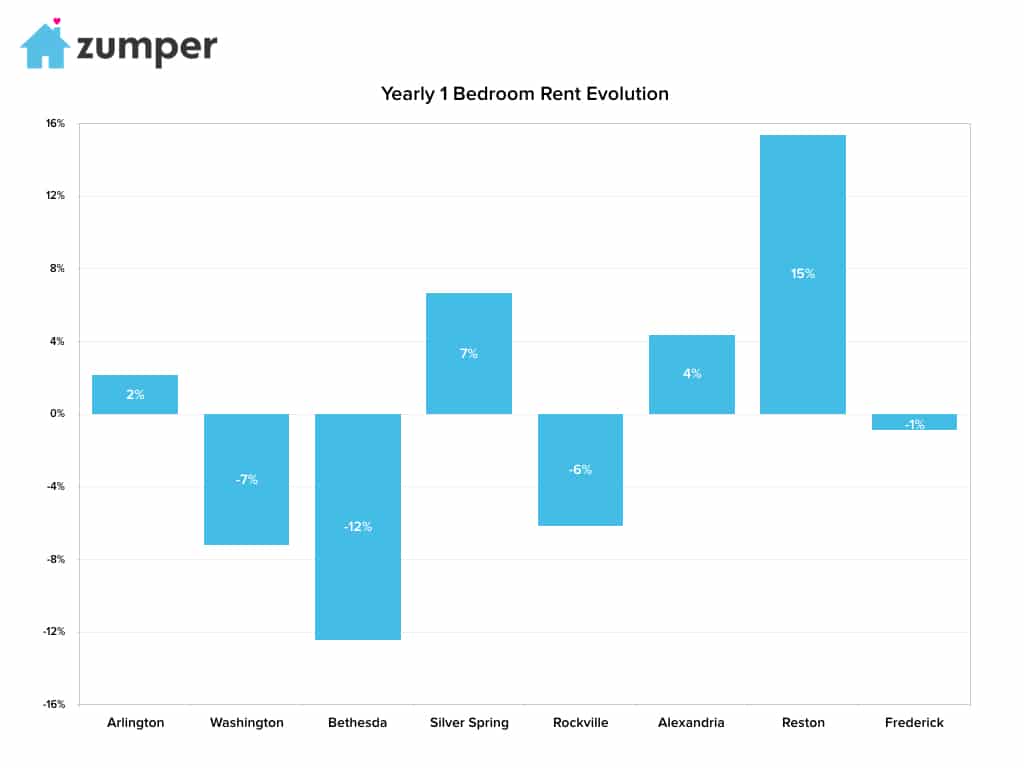
The Fastest Growing (Y/Y%)
–Reston, VA had the fastest growing yearly rent, up 15.4%.
–Silver Spring, MD rent was the second fastest growing, up 6.7% since this time last year.
–Alexandria, VA rent ranked as third with a yearly growth rate of 2.5%.
The Fastest Growing (M/M%)
–Reston, VA rent also had the fastest growing monthly rate, up 5.1%.
–Silver Spring, MD followed as second with rent up 2.9% since last month.
–Frederick, MD was third with a 2.7% monthly growth rate.
Full Data
| One Bedroom | Two Bedrooms | ||||||
|---|---|---|---|---|---|---|---|
| Pos. | City | Price | M/M % | Y/Y % | Price | M/M % | Y/Y % |
| 1 | Coronado | $2,700 | 5.10% | -15.10% | $3,710 | -4.90% | -14.90% |
| 2 | Encinitas | $1,700 | 0.00% | 1.20% | $2,900 | -4.90% | 15.10% |
| 3 | Carlsbad | $1,670 | 2.50% | 5.70% | $2,290 | 1.80% | 11.70% |
| 4 | San Diego | $1,590 | 0.60% | 6.00% | $2,160 | -1.80% | 6.40% |
| 5 | Poway | $1,530 | -5.00% | -1.30% | $1,670 | -0.60% | -2.90% |
| 6 | Vista | $1,520 | -1.90% | -0.70% | $1,710 | 0.60% | 3.00% |
| 7 | San Marcos | $1,470 | 4.30% | -9.30% | $1,890 | -1.60% | 6.20% |
| 8 | Oceanside | $1,460 | 0.70% | 5.80% | $1,800 | -1.10% | 6.50% |
| 9 | Chula Vista | $1,450 | 3.60% | 15.10% | $1,880 | 4.40% | 9.90% |
| 10 | Escondido | $1,390 | 5.30% | 14.90% | $1,650 | 0.00% | 9.30% |
| 10 | La Mesa | $1,390 | 0.00% | 14.90% | $1,730 | -3.90% | 5.50% |
| 11 | Imperial Beach | $1,260 | 5.00% | 11.50% | $1,620 | -0.60% | 7.30% |
| 11 | National City | $1,260 | 5.00% | 12.50% | $1,640 | 1.20% | 3.80% |
| 12 | El Cajon | $1,230 | 2.50% | 11.80% | $1,530 | 2.70% | 10.90% |
About
The Zumper DC Metro Report analyzed over 55,000 active listings that hit the market in April 2017. Listings are aggregated by city to calculate median asking rents.
In the market for a new place? Search all DC apartments for rent on Zumper now.
Stay up to date with Zumper by following us on Facebook, Twitter, Instagram, & Pinterest.
Related content


