
With Valentines Day around the corner, we at Zumper wanted to see just which U.S. city was the most accommodating for couples. We created an index that included cost of living, populations of married and divorced individuals, number of restaurants, and Valentines Day engagement. With those categories in mind, we’ve compiled a comprehensive list to highlight the standout cities for couples.
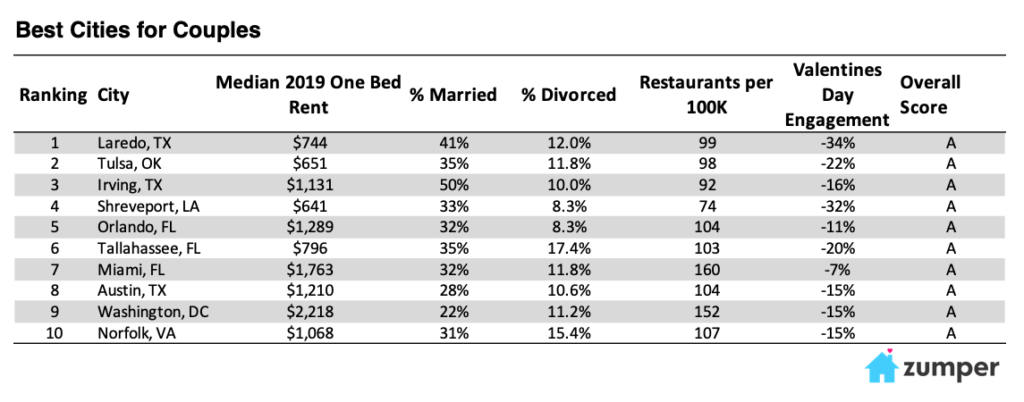
Texas & Florida Dominate the Top 10
Texas cities were brought to the top by low divorced populations, high married populations, and generally affordable rent prices. Laredo reigned as the best city for couples both nationally and statewide. Florida, similarly, had 3 cities in the top 10 as well with Orlando leading the pack. Two east coast cities narrowly made it into the bottom as 9th and 10th but still earning A’s. No west coast city appeared in the top rankings, most likely pulled down by expensive rents.
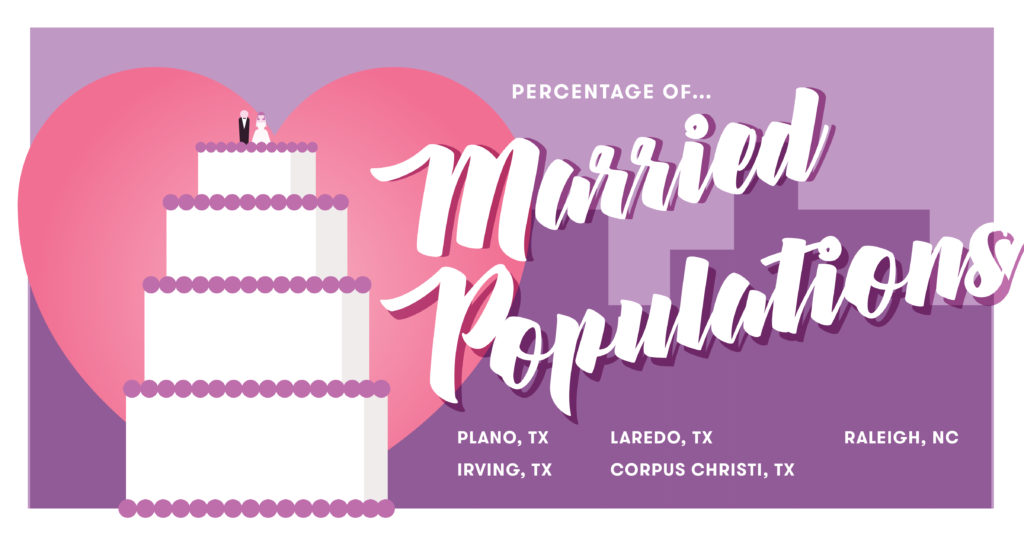
Cities with The Largest Married Populations
Texas seems to be the most committed state as cities here had some of the highest populations of married couples in the nation. Plano was especially notable as over half of the population was married. The only Texas city that did not earn an ‘A’ grade was Corpus Christi, though it still warranted a respectable B overall. Raleigh was the only non-Texas city that made it into the top 5 with a 40% married population.

Cities with The Lowest Divorced Populations
Columbus had the lowest divorced population at just 5.5%. Buffalo, Shreveport, and Orlando followed suit each with around 8% divorced populations and Madison rounded off the top 5 with about 9%. Knowing that about half of marriages in the U.S. end in divorce, these standout cities really show their dedication.

Cities with The Most Restaurants Per Capita
With 246 restaurants per capita, funky New Orleans beat out San Francisco for the city with the most restaurants per capita. San Francisco hovered at a close 240. 2 other West Coast cities made it into the top 5 as well: Portland and Seattle with 239 and 208 restaurants per capita, respectively. St. Petersburg was the only east coast city to make it on this last, ranking as 4th with 216 restaurants per capita.

Cities with The Highest Valentines Day Engagement
Santa Ana had the largest dip in traffic to Zumper.com on Valentines Day last year compared to the week before, dropping 63%. Similarly, Henderson renters were busy on dates on the 14th with a 55% drop. Chandler, Laredo, and Fort Worth finished off the top 5 cities all with traffic all decreasing around 30-35%.
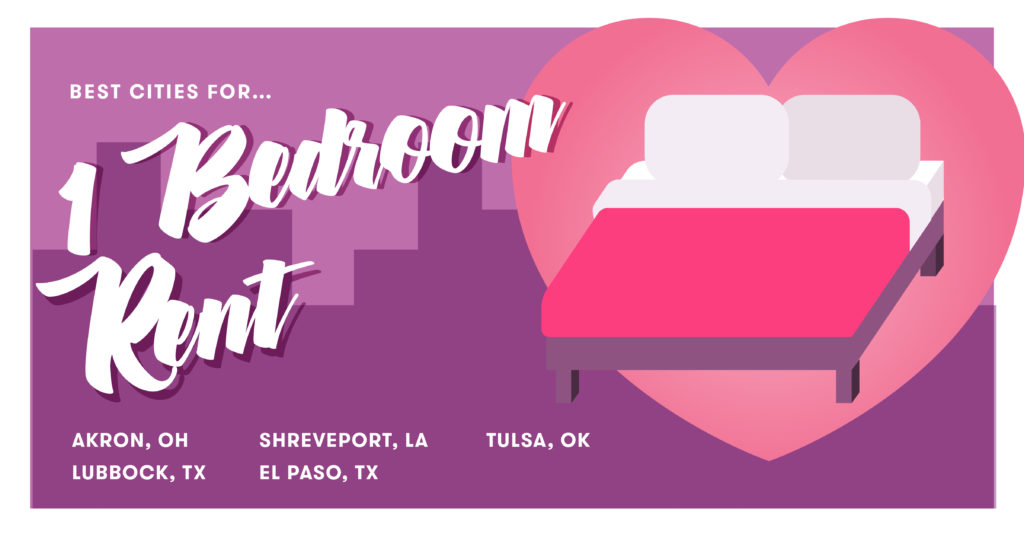
Cities with The Most Affordable One-bedroom Rent
Similar to our monthly National Rent Report, these top 5 most affordable cities all had median one bedroom rent for 2019 priced around $650 or below. Akron had the least expensive median rent, only priced at about $576 for 2019. At that rate, splitting rent would be less than $300 a person, which gives a couple more money to spend on restaurants and other fun bonding activities.
Methodology
To determine the best cities for couples, we analyzed data from 100 of the most populated U.S cities across the United States on five key metrics. These metrics included:
- Median 1 bedroom rent – data from Zumper
- Valentines Day Engagement (comparing traffic to Zumper on 2/7/2019 and 2/14/2019 with decreased traffic on Valentines day signaling higher date engagement) – data from Zumper
- Percentage of married population – data from Zumper’s 2019 State of The American Renter Report
- Percentage of divorced population – data from Zumper’s 2019 State of The American Renter Report
- Number of restaurants per capita – Yelp API
Each metro area then received a rank and weighted score for each metric. In terms of weightings, the percentage of married men and women, percentage of divorced men and women, and restaurants per capita each accounted for 25% of the final score. Valentines Day Engagement accounted for 25%, and median 1 bedroom rent for the last 10%. The final rankings were determined by adding up each city’s weighted scores to see who scored highest overall.
To convert scores into letter grades, all the metros were adjusted on a curve so that the top scoring city received the highest mark, an A.
Full Data
| Rank | City | Median 2019 One Bed Rent | % Married | % Divorced | Restaurants per 100K (Yelp) | Valentines Day Engagement | Final Grade |
|---|---|---|---|---|---|---|---|
| 1 | Laredo, TX | $744 | 41% | 12.00% | 99 | -34% | A |
| 2 | Tulsa, OK | $651 | 35% | 11.80% | 98 | -22% | A |
| 3 | Irving, TX | $1,131 | 50% | 10.00% | 92 | -16% | A |
| 4 | Shreveport, LA | $641 | 33% | 8.30% | 74 | -32% | A |
| 5 | Orlando, FL | $1,289 | 32% | 8.30% | 104 | -11% | A |
| 6 | Tallahassee, FL | $796 | 35% | 17.40% | 103 | -20% | A |
| 7 | Miami, FL | $1,763 | 32% | 11.80% | 160 | -7% | A |
| 8 | Austin, TX | $1,210 | 28% | 10.60% | 104 | -15% | A |
| 9 | Washington, DC | $2,218 | 22% | 11.20% | 152 | -15% | A |
| 10 | Norfolk, VA | $1,068 | 31% | 15.40% | 107 | -15% | A |
| 11 | San Francisco, CA | $3,603 | 21% | 10.30% | 240 | -10% | A |
| 12 | Boston, MA | $2,478 | 19% | 9.60% | 128 | -20% | A |
| 13 | New York, NY | $2,938 | 16% | 8.60% | 135 | -24% | A |
| 14 | Plano, TX | $1,174 | 59% | 33.30% | 127 | -28% | A |
| 15 | Virginia Beach, VA | $1,043 | 23% | 16.70% | 145 | -14% | A |
| 16 | Raleigh, NC | $1,019 | 39% | 10.20% | 84 | -3% | A |
| 17 | Denver, CO | $1,551 | 25% | 14.40% | 120 | -11% | A |
| 18 | San Diego, CA | $1,795 | 29% | 19.00% | 106 | -17% | A |
| 19 | St Louis, MO | $868 | 21% | 15.20% | 124 | -15% | A |
| 20 | Omaha, NE | $821 | 28% | 10.30% | 92 | -5% | A |
| 21 | Madison, WI | $1,195 | 14% | 8.60% | 140 | -8% | B |
| 22 | Chesapeake, VA | $1,116 | 33% | 11.10% | 83 | -6% | B |
| 23 | Pittsburgh, PA | $1,127 | 16% | 16.70% | 150 | -17% | B |
| 24 | Scottsdale, AZ | $1,394 | 33% | 33.30% | 164 | -10% | B |
| 25 | Corpus Christi, TX | $860 | 40% | 12.00% | 80 | -3% | B |
| 26 | Seattle, WA | $1,898 | 23% | 17.40% | 208 | -5% | B |
| 27 | Oklahoma City, OK | $729 | 23% | 23.30% | 103 | -28% | B |
| 28 | Oakland, CA | $2,366 | 18% | 11.80% | 137 | -9% | B |
| 29 | Las Vegas, NV | $981 | 32% | 18.40% | 88 | -10% | B |
| 30 | Dallas, TX | $1,233 | 34% | 18.60% | 89 | -10% | B |
| 31 | Minneapolis, MN | $1,393 | 21% | 16.30% | 126 | -10% | B |
| 32 | Winston Salem, NC | $812 | 11% | 10.50% | 90 | -25% | B |
| 32 | Greensboro, NC | $722 | 30% | 13.30% | 91 | 3% | B |
| 34 | Columbus, OH | $862 | 16% | 5.50% | 85 | -14% | B |
| 35 | Los Angeles, CA | $2,279 | 24% | 14.10% | 90 | -14% | B |
| 36 | Fort Lauderdale, FL | $1,607 | 22% | 23.40% | 130 | -20% | B |
| 37 | Augusta, GA | $758 | 36% | 10.70% | 73 | 6% | B |
| 38 | Salt Lake City, UT | $1,112 | 28% | 22.80% | 109 | -8% | B |
| 39 | Tampa, FL | $1,145 | 25% | 25.20% | 108 | -14% | B |
| 40 | Santa Ana, CA | $1,612 | 28% | 16.70% | 45 | -63% | B |
| 41 | Baltimore, MD | $1,174 | 24% | 11.70% | 61 | -16% | C |
| 41 | Sacramento, CA | $1,261 | 28% | 17.10% | 104 | 2% | C |
| 43 | Lincoln, NE | $833 | 25% | 12.50% | 77 | -8% | C |
| 44 | Chicago, IL | $1,496 | 14% | 10.30% | 89 | -16% | C |
| 45 | San Jose, CA | $2,477 | 21% | 14.00% | 92 | -11% | C |
| 46 | Portland, OR | $1,384 | 21% | 20.80% | 239 | -8% | C |
| 47 | New Orleans, LA | $1,399 | 9% | 12.10% | 246 | -6% | C |
| 48 | Buffalo, NY | $1,107 | 16% | 8.00% | 124 | 26% | C |
| 49 | Newark, NJ | $1,329 | 26% | 13.90% | 71 | -11% | C |
| 50 | Honolulu, HI | $1,644 | 22% | 21.60% | 191 | -6% | C |
| 50 | Knoxville, TN | $815 | 28% | 16.70% | 86 | 2% | C |
| 52 | Durham, NC | $1,110 | 36% | 20.00% | 86 | -3% | C |
| 53 | Lubbock, TX | $634 | 16% | 15.80% | 76 | -29% | C |
| 54 | Fresno, CA | $997 | 28% | 18.80% | 92 | 1% | C |
| 55 | Milwaukee, WI | $1,257 | 18% | 18.20% | 86 | -22% | C |
| 56 | Chattanooga, TN | $1,015 | 27% | 30.00% | 117 | -5% | C |
| 57 | Lexington, KY | $748 | 25% | 25.00% | 93 | -7% | C |
| 58 | Charlotte, NC | $1,211 | 23% | 21.30% | 95 | -9% | C |
| 59 | Long Beach, CA | $1,570 | 22% | 18.00% | 75 | -19% | C |
| 60 | Chandler, AZ | $1,203 | 9% | 12.00% | 73 | -34% | C |
| 61 | Bakersfield, CA | $763 | 22% | 19.50% | 67 | -20% | D |
| 62 | Houston, TX | $1,123 | 22% | 20.60% | 79 | -18% | D |
| 63 | Providence, RI | $1,432 | 18% | 18.40% | 179 | 28% | D |
| 64 | San Antonio, TX | $898 | 25% | 28.90% | 76 | -18% | D |
| 65 | Atlanta, GA | $1,433 | 19% | 20.20% | 102 | -11% | D |
| 66 | Jacksonville, FL | $939 | 20% | 31.80% | 90 | -23% | D |
| 67 | Kansas City, MO | $947 | 21% | 27.20% | 114 | -6% | D |
| 68 | Colorado Springs, CO | $944 | 33% | 19.60% | 75 | 1% | D |
| 69 | Philadelphia, PA | $1,417 | 15% | 12.00% | 82 | -9% | D |
| 70 | Rochester, NY | $919 | 11% | 18.50% | 107 | -6% | D |
| 71 | St Petersburg, FL | $1,123 | 19% | 22.60% | 216 | 35% | D |
| 72 | Memphis, TN | $828 | 14% | 14.30% | 83 | -7% | D |
| 73 | Cincinnati, OH | $1,036 | 8% | 27.00% | 133 | -11% | D |
| 74 | Syracuse, NY | $938 | 12% | 20.00% | 164 | 12% | D |
| 75 | Henderson, NV | $1,120 | 25% | 37.50% | 57 | -55% | D |
| 76 | Wichita, KS | $712 | 25% | 30.00% | 97 | 18% | D |
| 77 | Anchorage, AK | $907 | 22% | 33.30% | 93 | -7% | D |
| 78 | Nashville, TN | $1,305 | 21% | 22.80% | 112 | 10% | D |
| 79 | Anaheim, CA | $1,686 | 33% | 18.50% | 61 | 15% | D |
| 80 | Indianapolis, IN | $818 | 17% | 17.80% | 84 | -3% | D |
| 81 | Gilbert, AZ | $1,191 | 20% | 10.00% | 65 | 35% | F |
| 82 | Richmond, VA | $1,070 | 11% | 24.20% | 157 | 1% | F |
| 83 | Reno, NV | $1,022 | 17% | 30.60% | 107 | -7% | F |
| 84 | Baton Rouge, LA | $813 | 10% | 11.00% | 86 | 68% | F |
| 85 | Mesa, AZ | $906 | 29% | 20.00% | 57 | 7% | F |
| 86 | Aurora, CO | $1,128 | 36% | 31.80% | 58 | -4% | F |
| 87 | Louisville, KY | $868 | 6% | 25.00% | 145 | -1% | F |
| 88 | Des Moines, IA | $802 | 19% | 19.40% | 83 | -2% | F |
| 89 | El Paso, TX | $643 | 25% | 41.70% | 82 | -4% | F |
| 90 | Boise, ID | $990 | 32% | 36.80% | 77 | 0% | F |
| 91 | Phoenix, AZ | $989 | 24% | 22.50% | 63 | -4% | F |
| 92 | Tucson, AZ | $653 | 17% | 18.90% | 84 | 5% | F |
| 93 | Fort Worth, TX | $1,109 | 17% | 36.20% | 71 | -32% | F |
| 94 | Cleveland, OH | $1,161 | 11% | 18.40% | 81 | -7% | F |
| 95 | Glendale, AZ | $852 | 21% | 28.60% | 56 | -12% | F |
| 96 | Akron, OH | $576 | 14% | 20.00% | 52 | -10% | F |
| 97 | Albuquerque, NM | $688 | 23% | 31.40% | 83 | 9% | F |
| 98 | Detroit, MI | $882 | 14% | 24.40% | 52 | -14% | F |
| 99 | Arlington, TX | $890 | 20% | 25.00% | 70 | -1% | F |
| 100 | Spokane, WA | $784 | 6% | 27.30% | 92 | 13% | F |
Related content