The Zumper Baltimore Metro Report analyzed active listings in May across 13 metro cities to show the most and least expensive cities and cities with the fastest growing rents.
Cities Ranked By Rent
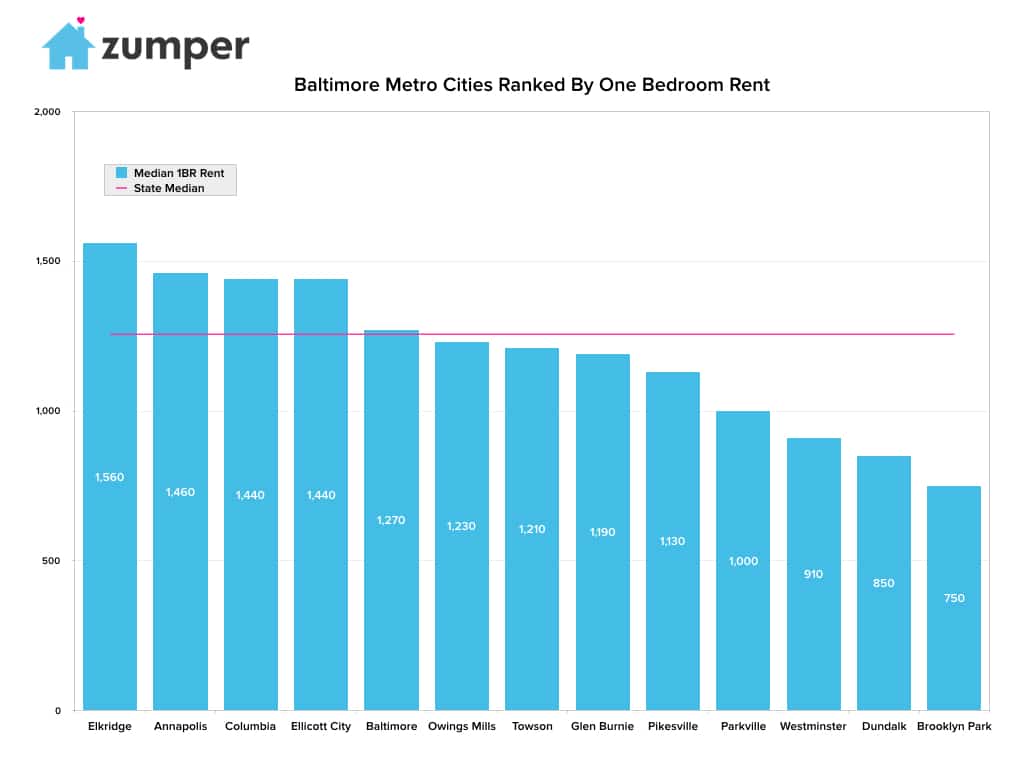
The Most Expensive
–Elkridge, MD had the most expensive rent with one bedroom units priced at $1,560.
–Annapolis, MD ranked as second with rent at $1,460.
–Columbia & Ellicott City, MD were tied for the third priciest city with rent at $1,440.
The Least Expensive
–Brooklyn Park, MD rent remained flat at $750 and continued to be the most affordable in the metro area.
–Dundalk, MD ranked as second with one bedroom rent at $850.
–Westminster, MD rent grew 4.6% to $910 last month but stayed the third least expensive.
Growth Rate
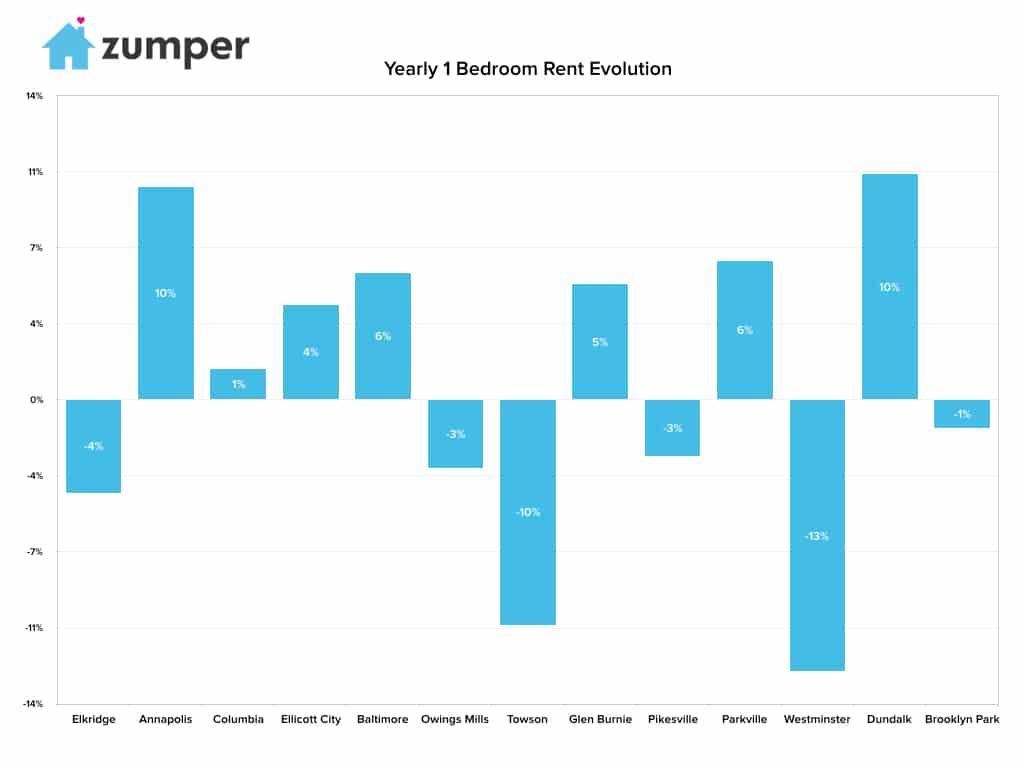
The Fastest Growing (Y/Y%)
–Dundalk, MD rent was the fastest growing, up 10.4% since this time last year.
–Annapolis, MD had the second fastest growing rent, climbing 9.8%.
–Parkville, MD had the third largest yearly growth rate, up 6.4%.
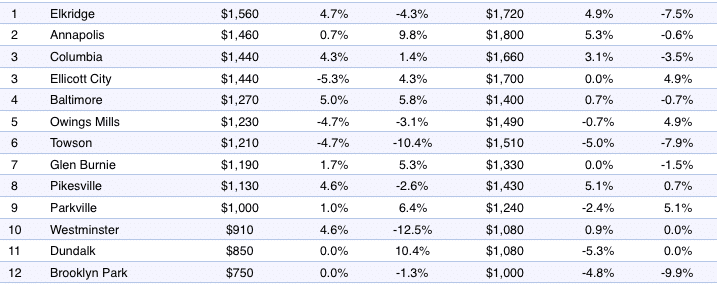
The Fastest Growing (M/M%)
–Elkridge, MD rent grew 4.7% since last month, making it the fastest growing.
–Pikesville & Westminster, MD tied for second place with rents up 4.6% since last month.
–Columbia, MD had the third largest monthly growth rate at 4.3%.
Full Data
| 1 Bedroom | 2 Bedrooms | ||||||
|---|---|---|---|---|---|---|---|
| Pos. | City | Price | M/M % | Y/Y % | Price | M/M % | Y/Y % |
| 1 | Arlington Heights | $1.670 | 5,0% | 15,2% | $2.070 | 5,1% | 14,4% |
| 2 | Chicago | $1.670 | -5,1% | -5,1% | $2.150 | -4,9% | -12,2% |
| 3 | Wheaton | $1.420 | 2,2% | -4,7% | $1.550 | 3,3% | -4,9% |
| 4 | Oak Park | $1.350 | 3,8% | -8,2% | $1.990 | -0,5% | 7,6% |
| 5 | Naperville | $1.240 | 0,8% | -11,4% | $1.550 | 0,0% | -1,3% |
| 6 | Schaumburg | $1.200 | -1,6% | -0,8% | $1.500 | 0,0% | 0,7% |
| 7 | Skokie | $1.170 | 5,4% | -8,6% | $1.520 | 4,8% | 1,3% |
| 8 | Mount Prospect | $1.100 | 0,9% | 0,9% | $1.420 | 5,2% | -5,3% |
| 9 | Bolingbrook | $1.080 | 4,9% | -8,5% | $1.530 | -5,0% | 6,3% |
| 10 | Palatine | $1.060 | 1,0% | 7,1% | $1.350 | 0,0% | 3,8% |
| 11 | Aurora | $1.040 | 1,0% | -2,8% | $1.400 | -4,1% | -2,1% |
| 12 | Des Plaines | $1.040 | -1,9% | -1,9% | $1.310 | -3,7% | -14,4% |
| 13 | Oak Lawn | $1.000 | -4,8% | 7,5% | $1.240 | 0,0% | -4,6% |
| 14 | Berwyn | $890 | -1,1% | 6,0% | $1.300 | 0,8% | 6,6% |
| 15 | Elgin | $860 | -5,5% | -3,4% | $1.270 | 0,0% | -2,3% |
| 16 | Kenosha | $850 | 4,9% | 14,9% | $990 | 0,0% | 15,1% |
| 17 | Waukegan | $790 | -4,8% | -9,2% | $1.070 | 1,9% | -2,7% |
| 18 | Joliet | $720 | 0,0% | -10,0% | $880 | 1,1% | -11,1% |
| 19 | Hammond | $680 | -2,9% | 3,0% | $850 | 4,9% | 6,3% |
About
The Zumper Baltimore Metro Report analyzed active listings that hit the market in May 2017. Listings are aggregated by city to calculate median asking rents.
In the market for a new place? Search all Baltimore apartments for rent on Zumper now.
Stay up to date with Zumper by following us on Facebook, Twitter, Instagram, & Pinterest.
Related content


