The Zumper Baltimore Metro Report analyzed active listings in January across 13 metro cities to show the most and least expensive cities and cities with the fastest growing rents. The Maryland state median rent was $1,287 last month.
Cities Ranked By Rent
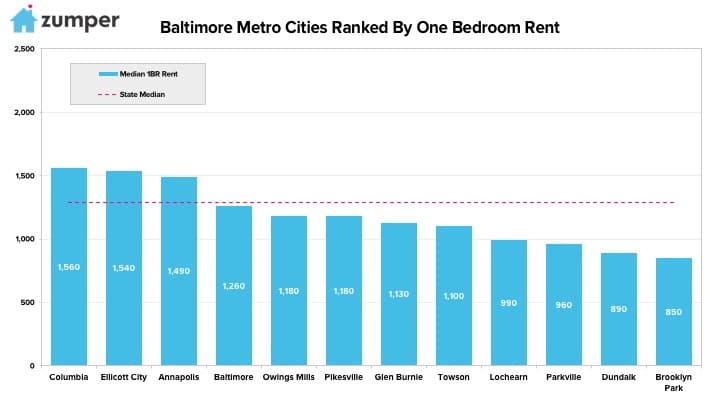
The Most Expensive
–Columbia, MD rent decreased $60 to $1,560 but continued to reign as the most expensive in the metro.
–Ellicott City, MD moved up one spot, and past Annapolis, to rank as the second priciest city with rent at $1,540.
–Annapolis, MD dropped one spot to third with one bedrooms priced at $1,490.
The Least Expensive
–Brooklyn Park, MD rent grew $30 to $850 but remained the most affordable.
–Dundalk, MD was the second least expensive city with rent at $890.
–Parkville, MD fell one spot and behind Lochearn to rank as the third most affordable with rent at $960.
Growth Rate
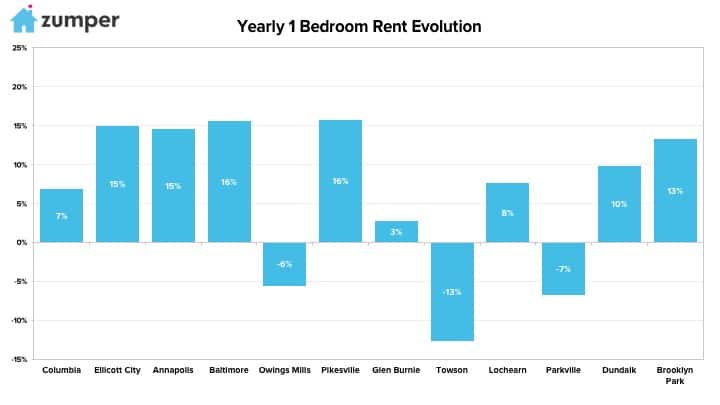
The Fastest Growing (Y/Y%)
–Pikesville, MD had the largest year over year rental growth rate, climbing 15.7%.
–Baltimore, MD followed closely behind as second with rent up 15.6%.
–Ellicott City, MD was third with rent growing 14.9%.
The Fastest Growing (M/M%)
–Lochearn, MD had the fastest growing rent last month, up 5.3%.
–Baltimore, MD ranked as second with rent growing 5%.
–Ellicott City, MD had the third largest monthly rental growth rate, climbing 4.8%.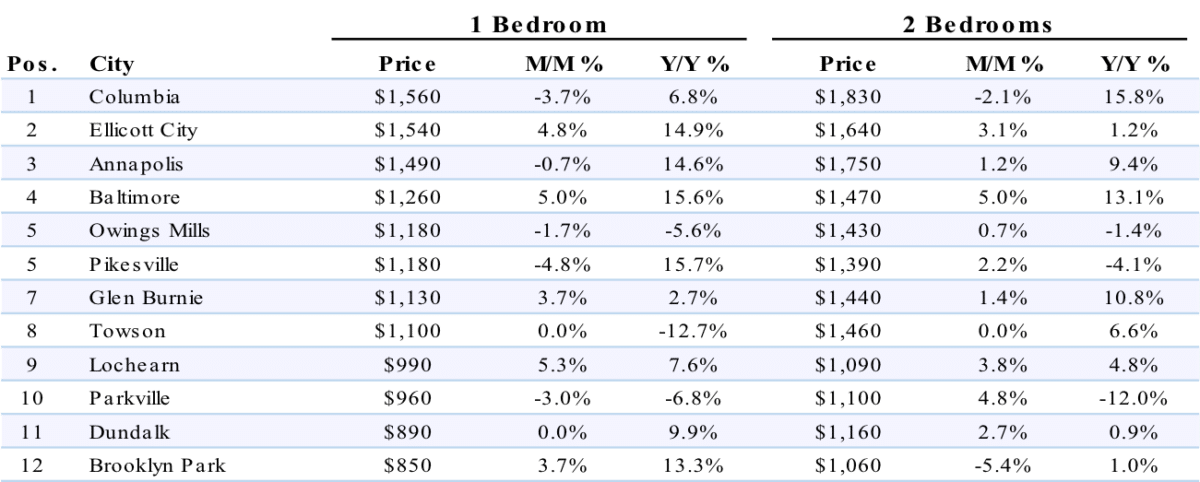
Full Data
| 1 Bedroom | 2 Bedrooms | ||||||
|---|---|---|---|---|---|---|---|
| Pos. | City | Price | M/M % | Y/Y % | Price | M/M % | Y/Y % |
| 1 | Portland | $1,330 | 0.00% | -2.20% | $1,560 | -2.50% | -1.90% |
| 2 | Gladstone | $1,250 | 0.00% | 8.70% | $1,290 | -0.80% | -5.80% |
| 3 | Lake Oswego | $1,210 | 2.50% | 6.10% | $1,540 | 0.70% | 4.80% |
| 4 | Tualatin | $1,200 | -3.20% | -0.80% | $1,260 | -1.60% | -0.80% |
| 5 | Happy Valley | $1,180 | -4.80% | 5.40% | $1,440 | 5.10% | 8.30% |
| 6 | Hillsboro | $1,150 | 2.70% | -13.50% | $1,450 | -0.70% | -2.70% |
| 7 | Milwaukie | $1,120 | 2.80% | 0.90% | $1,240 | -0.80% | 0.80% |
| 7 | Wilsonville | $1,120 | 0.90% | 0.00% | $1,240 | 0.00% | -8.80% |
| 9 | Beaverton | $1,090 | 1.90% | -1.80% | $1,300 | 0.00% | -3.70% |
| 10 | Gresham | $1,000 | 0.00% | 1.00% | $1,190 | 3.50% | 5.30% |
| 10 | Tigard | $1,000 | 0.00% | 5.30% | $1,200 | 1.70% | 9.10% |
| 12 | Oregon City | $950 | -2.10% | 9.20% | $1,350 | 3.80% | 8.90% |
| 13 | Forest Grove | $880 | -1.10% | -6.40% | $1,140 | 4.60% | -5.00% |
About
The Zumper Baltimore Metro Report analyzed active listings that hit the market in January 2018. Listings are aggregated by city to calculate median asking rents.
In the market for a new place? Search all Baltimore apartments for rent on Zumper now.
Stay up to date with Zumper by following us on Facebook, Twitter, Instagram, & Pinterest.
Related content


